
Figure 6. EPO analysis in CD133+ cells and dermal fibroblasts.
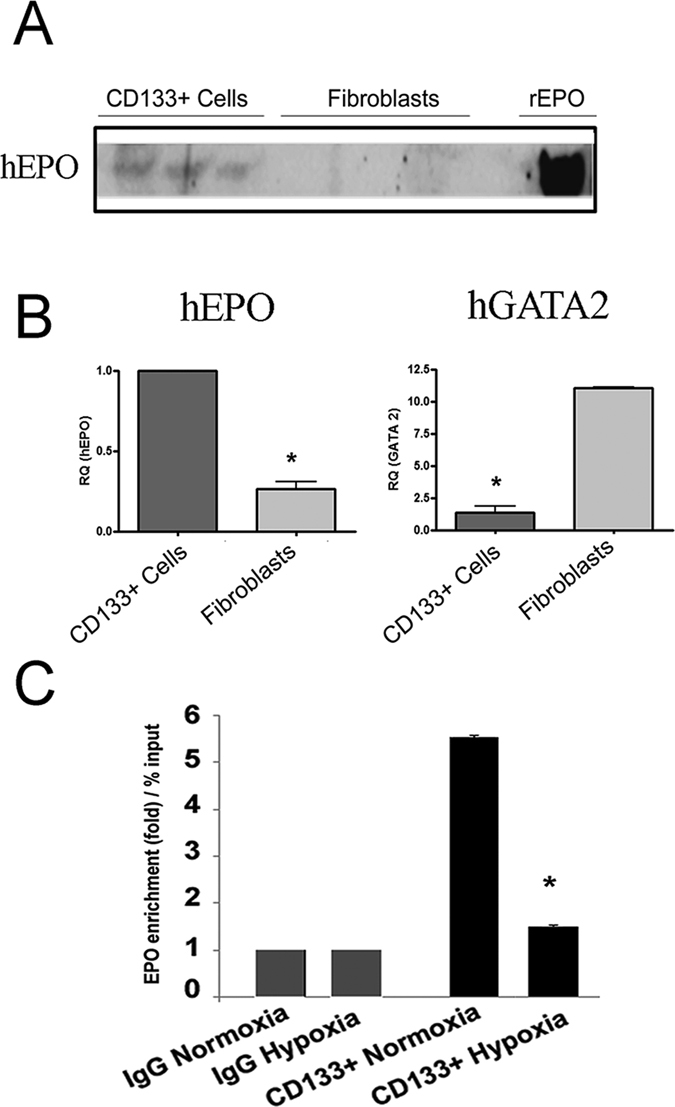
(A) Micrographs showing Western Blot analysis of hEPO in the supernatant cultures of CD133+ cells as compared to fibroblasts (3 representative cell lines). Recombinant EPO (rEPO) was loaded as control. (B) Quantitative RT-PCR analysis showing increased mRNA levels of human EPO and decreased GATA2 expression in CD133+ cells as compared to fibroblasts. Data are the mean ± SD of three experiments. Data are normalized to GAPDH mRNA and to 1 for CD133+ cells and expressed as relative quantification (RQ). (C) ChIP analysis of binding of GATA2 at EPO transcriptional motif in CD133+ cells in normoxia or hypoxia. Hypoxia reduced the binding of GATA2 by five folds in CD133+ cells. All data are means ± SD of 3 different experiments. T-test: *p < 0.01.