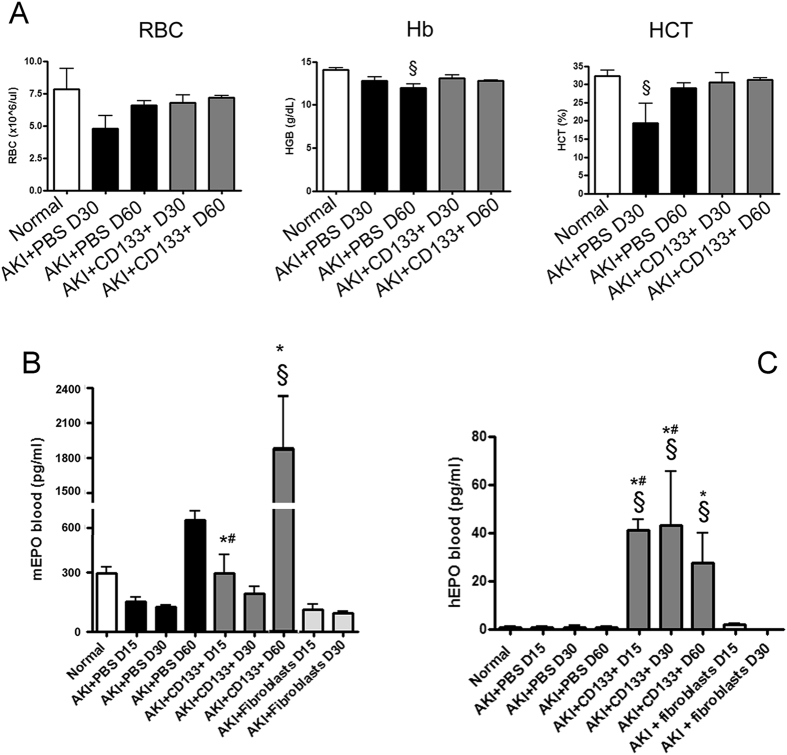
Figure 7. Analysis of AKI mice blood.
(A) Whole blood analysis of mice (normal and AKI mice) at day 30 and day 60, showing levels of red blood cells (RBC), haemoglobin (Hb) and haematocrit (HCT). Data are mean ± SD of three different mice per group. Newman Keuls’ multicomparison test was performed: §p < 0.01 versus Normal. (B,C) Detection of murine and human EPO in plasma of normal and AKI mice treated with PBS, CD133+ cells or dermal fibroblasts at day 15, 30 and 60 after injury. Data are mean ± SD of three experiments analysing at least three different mice per group. Newman Keuls’ multicomparison test was performed: §p < 0.01 versus Normal; *p < 0.01 versus PBS, #p < 0.01 versus fibroblasts.

