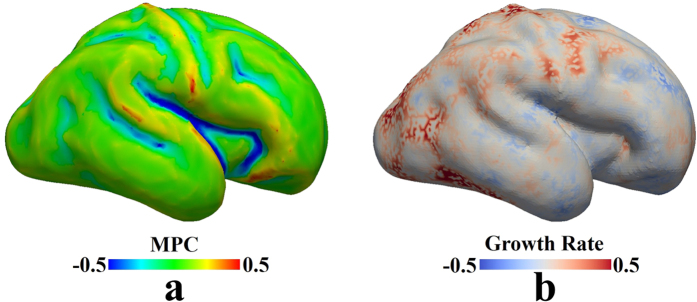
Figure 1. Comparison between cortical folding patterns and cortical growth rates.
The white matter surface of the 31st week fetal brain atlas is used as a reference. (a) Maximal principal curvature (MPC) measured on the surface is used to represent the gyro-sulcal folding patterns. Convex patterns have positive MPC values whereas concave patterns have negative values. (b) Growth rate is computed vertex-wise based on the cortical thickness values from the 25th week fetal brain to the 31st week fetal brain. The spherical registration method43 is used to warp the other white matter surfaces (from the 25th week to the 30th week) to the 31st week one and correspondences between vertices across time are established accordingly. Growth rate is defined as the slope of the linear regression fit to the cortical thickness curve.

