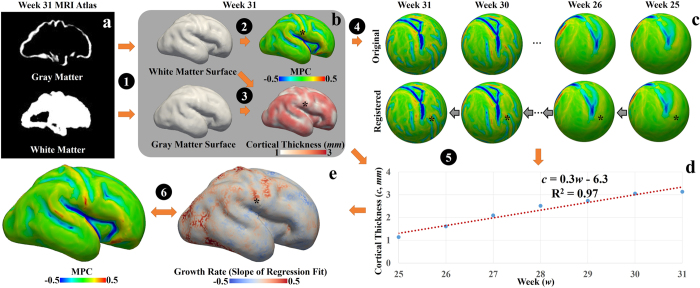
Figure 6.
(a) MRI atlas of the 31st week fetal brain. (b) Structural MRI data processing of one-time point (the 31st week brain is used as an example). Step 1: White matter surface and gray matter surface are reconstructed from the atlas via FreeSurfer. Step 2: maximal principal curvatures (MPCs) are obtained on the white matter surface. Step 3: Cortical thickness is obtained based on the white matter surface and gray matter surface. These processing steps are applied to surfaces of other time points. (c) Establishment of correspondence of vertices across time course. Step 4: The spherical registration method43 is used to warp white matter surfaces of all time points to the same spherical space (the 31st week). Black stars in (b) and (c) illustrate a vertex on the 31st week white matter surface and the corresponding vertices on the other surfaces. (d) Cortical thickness values of the vertex highlighted by the black star at different time points. The linear regression model is used to fit the thickness curve. The slope of the regression fit is used as a measurement of the growth rate of the cortex over time. (e) Growth rate is mapped to the 31st week white matter surface. Step 6: Joint analysis of MPC map and growth rate map.

