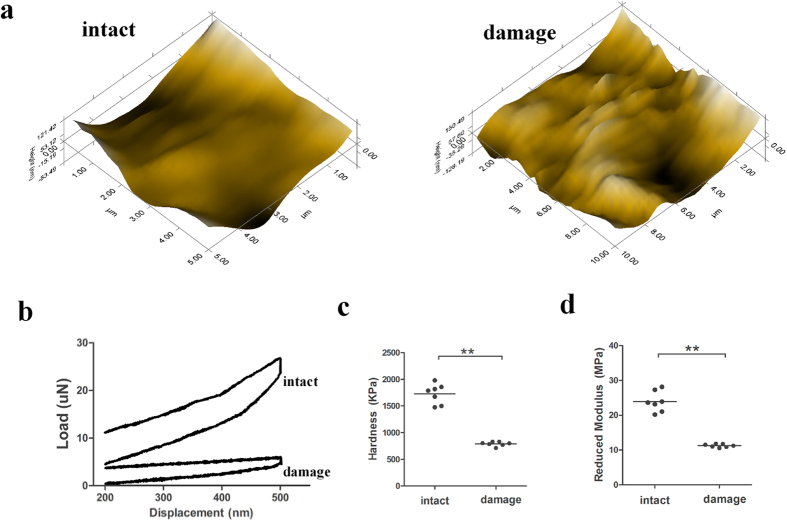
Figure 3. Assessment of cartilage biomechanics by nanoindentation.
(a) Microscopic geomorphology of the different regions was acquired during nanoindentation. (b) Typical load–displacement curves of two groups were recorded within a test range of 500 nm. (c) The biomechanical properties of hardness were calculated with the biomechanical curves. (d) The biomechanical properties of the reduced modulus were calculated with the biomechanical curves (n = 5, *p < 0.05, **p < 0.01).

