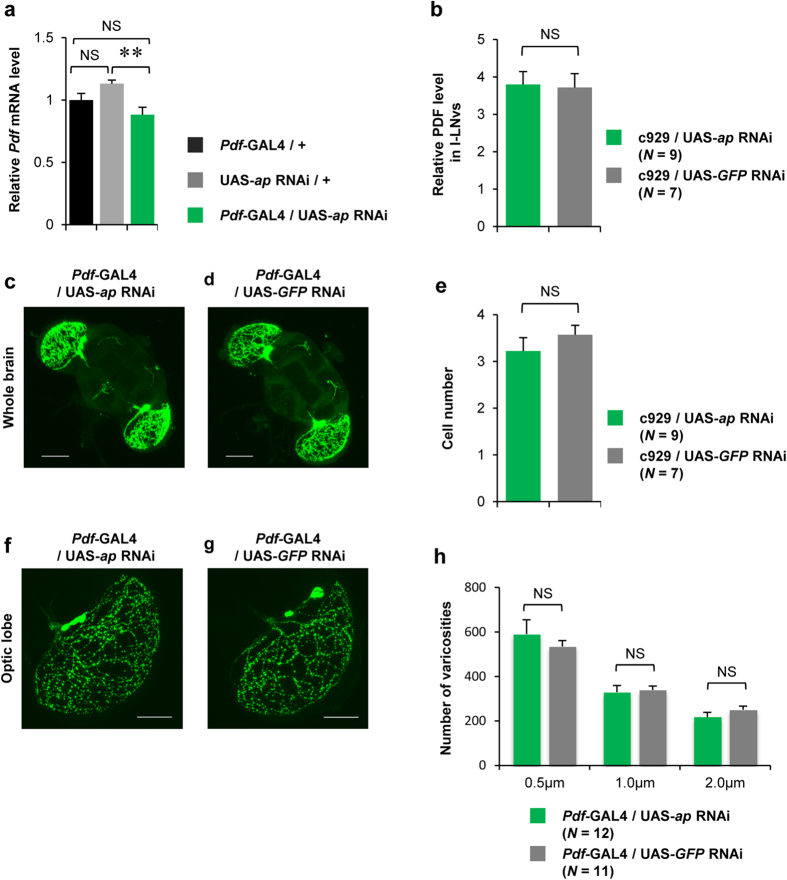
Figure 6. Knockdown of ap in l-LNvs does not affect PDF expression and number of PDF-releasing sites.
(a) Real-time qRT-PCR analysis of Pdf mRNA expression level using Pdf-GAL4/+, UAS-ap RNAi/+, and Pdf-GAL4/UAS-ap RNAi males. Mean ± SEM values were calculated from five replicates. NS, not significant; **P < 0.01. (b) Intensity ratio of PDF signals in l-LNvs and s-LNvs (l-LNvs/s-LNvs). c929/UAS-ap RNAi (green bar) and c929/UAS-GFP RNAi (gray bar) flies were used. N = 7–8 in each bar. (c and d) PDF immunolabeling in the whole brain. Stacked confocal image showing a front view of the adult brain. A scale bar represents 50 μm. (e) Cell number in l-LNvs. (f and g) PDF immunolabeling in the optic lobe. Stacked confocal image of an optic lobe. Scale bars represent 20 μm. (c and f) Pdf-GAL4/UAS-ap RNAi flies were used. (d and g) Pdf-GAL4/UAS-GFP RNAi flies were used as the control. (h) Number of varicosities in l-LNvs. The number of spots of diameters (0.5, 1, and 2 μm) was counted for each diameter. Pdf-GAL4/UAS-ap RNAi (green bar) and Pdf-GAL4/UAS-GFP RNAi (gray bar) flies were used. 11–12 brains were used for each genotype.

