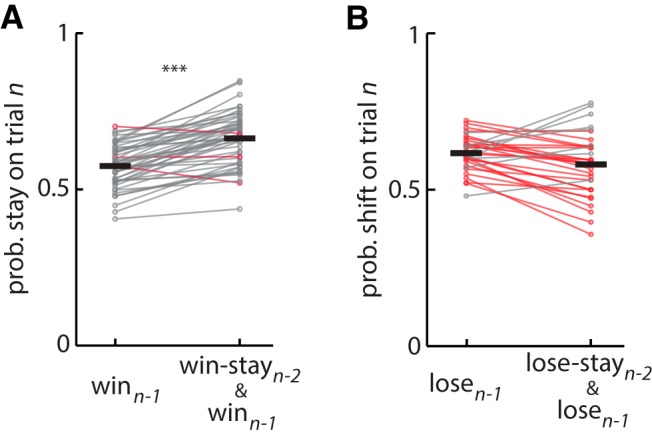
Figure 4.

Effect of consecutive wins or losses on choice: test for reinforcement learning. A, Plot of probability of a stay response on trial n, after a win (i.e., win-stay; left) or win-stay-win sequence (right) for each rat. The latter is the probability that the rat will chose the same feeder in three consecutive trials given wins on the first two of the set. The data show an increased probability of repeating the choice given two previous wins on the same feeder compared with a win on the previous trial, consistent with RL theory. B, Plot of probability of a switch response on trial n after a loss (lose-shift; left) or after a lose-stay-lose sequence (right). The probability of shifting after two consecutive losses to the same feeder is not greater than the probability of shifting after a loss on the previous trial, which is inconsistent with the predictions of RL theory. In both plots, gray lines indicate a within-subject increase in probability, whereas red lines indicate a decrease. ***Statistical significance of increased probability (p < 0.001) within subjects.
