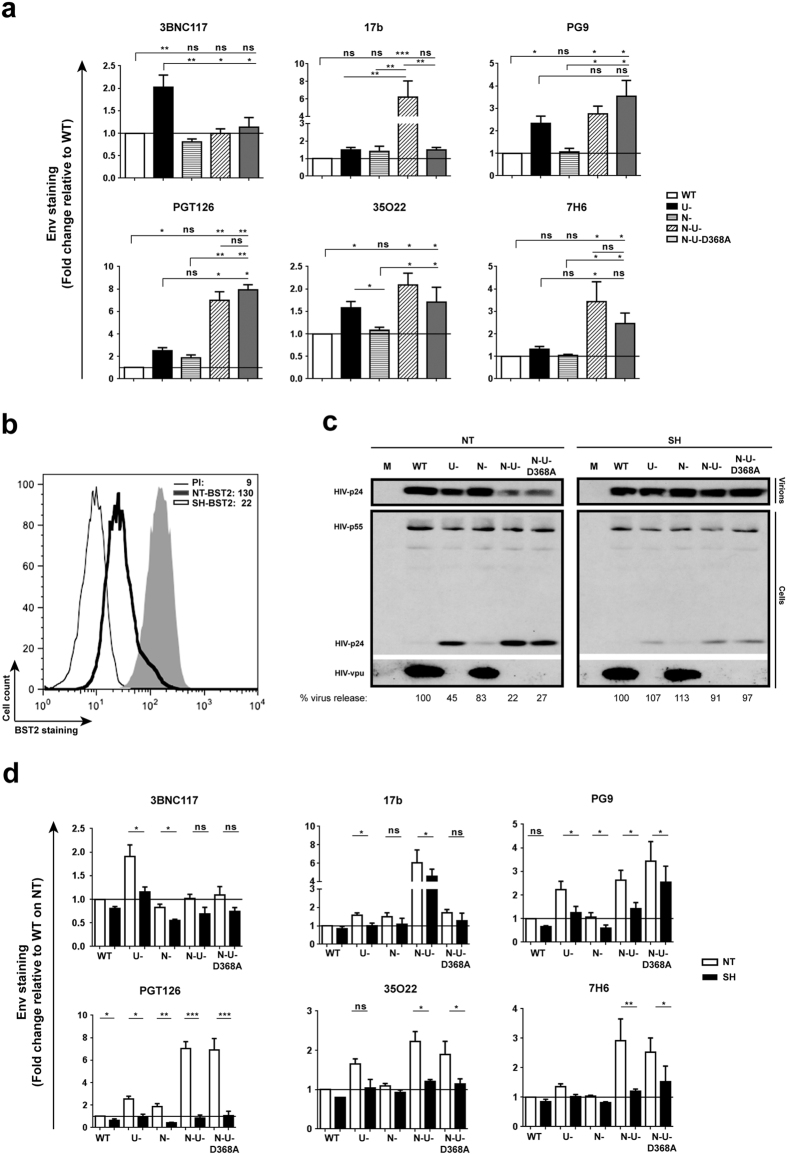
Figure 2. Tethering of HIV virions by BST2 enhances Env recognition by all classes of NAbs.
(a) Parental CEM CD4+ T cells were infected with CCR5-tropic NL4.3.ADA.IRES.GFP WT virus or derivatives lacking Vpu (U-), Nef (N-) or both proteins (N-U-) and examined for Env recognition by NAbs (5 μg/ml for PGT126 and 10 μg/ml for others). The N-U-D368A virus harbours a mutation within the CD4-binding site of Env causing defective CD4-Env engagement. (b–d) CEM cells expressing (NT) or depleted of (SH) BST2 (b) were infected with the viruses as in (a) and assessed for HIV particle release by Western blotting (c) and for Env recognition as indicated in Panel a (d). (a) Env staining on GFP+ parental CEM T cells. MFI levels on WT-virus infected cells were set at 1 (reference). Shown is a mean fold change of each condition relative to this reference (n = 3 to 4). In this Panel, two-way Anova analysis of variance with Dunn’s post hoc tests was used to compare Env recognition levels with different viruses. (b) BST2 staining on CEM T cells expressing or depleted of BST2 using anti-BST2 Ab or a rabbit pre-immune (PI) serum as control. Indicated inside the graph are MFI values for GFP+ cells from a representative analysis. (c) An example of viral particle release with mock (M)-infected cells used as control. Parallel virions and cells were analyzed for total Gag proteins and Vpu. Underneath the immunoblots are quantifications of the densitometry signals. Percentages of virus release were determined as a ratio of virion-associated Gag signals (corresponding to mature p24) over all cell-associated Gag signals (corresponding to p24 and precursor p55) × 100. Virus release by WT virus-infected cells of each cell line (NT or SH) was set at 100. (d) Env staining on GFP+ cells (n = 3 to 4). MFI levels on BST2-expressing (NT), WT-virus infected cells were set at 1 (reference). Shown is a mean fold change of each condition relative to this reference. In this Panel, paired, two-tailed Student’s t-tests were used to compare the effect of BST2 depletion on Env recognition.

