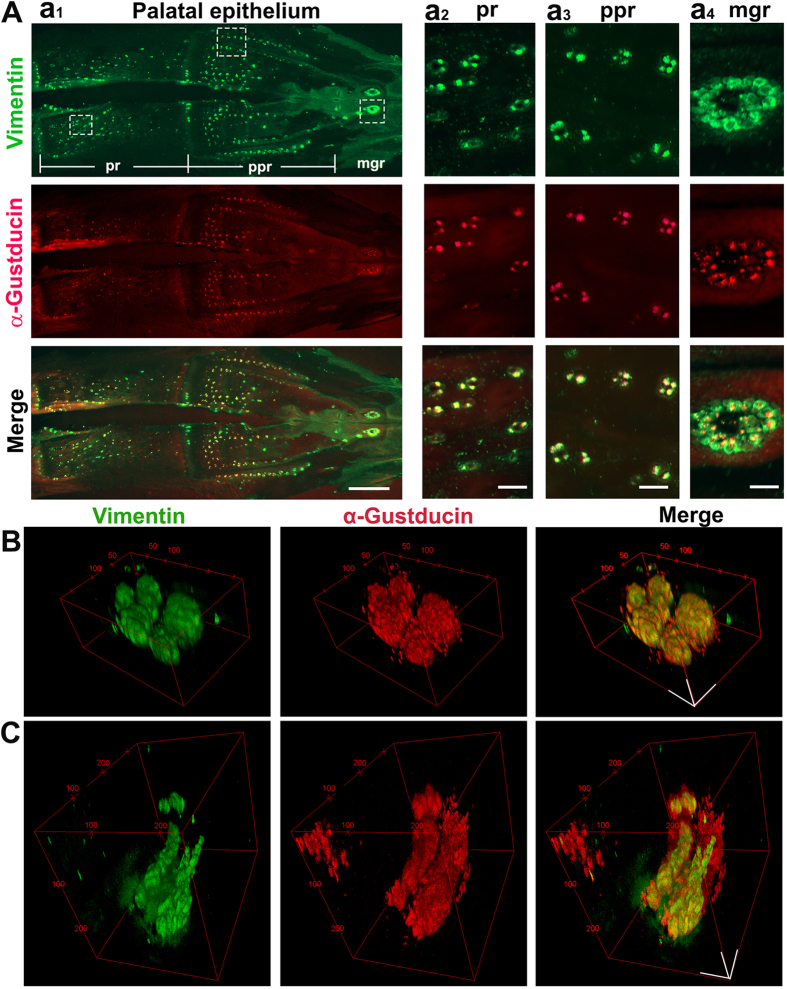
Figure 3. Taste buds in the palate.
(A) Photomicrographs of a palatal epithelial sheet from a P3 female chicken labeled with Vimentin (green) and α-Gustducin (red) to illustrate the distribution pattern of taste buds. Vimentin and α-Gustducin immunosignals were overlapping in taste buds. Squares with dashed lines mark the areas for the higher magnification images in a2–4 columns in the maxillary gland region (mgr), palatine papillae region (ppr) and posterior region (pr) of the palate, respectively. Scale bars: 2 mm for a1, 200 μm for a2–4. (B,C) 2 photon 3-D reconstructed images of a taste bud cluster showing ovoid-shaped (B) and tube-shaped (C) taste buds in the palatine papillae region and posterior region. Scale bars: 50 μm in (B) and (C).

