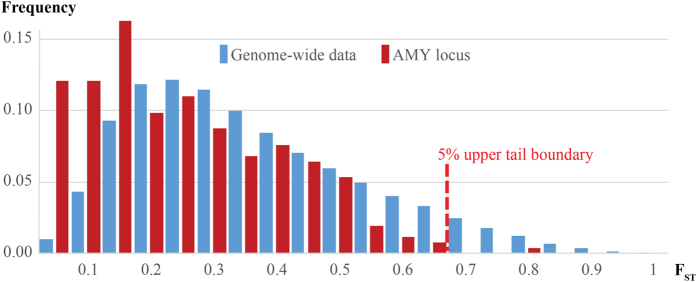
Figure 1. Distribution of estimates of maximum pairwise Fst per 200 kb non-overlapping segment among 12 human population groups.
‘AMY locus’ refers to data from three neighbouring 200 kb segments from the Chr1:103,800,000-104,400,000 region. The distribution of the maximum FST scores of the 200 kb regions is shown by bins of 0.05. The only 5% significant (red dotted line) FST estimate for the AMY locus comes from the African and Northeast Siberian comparison at the Chr1:104,000,000-104,200,000 segment.

