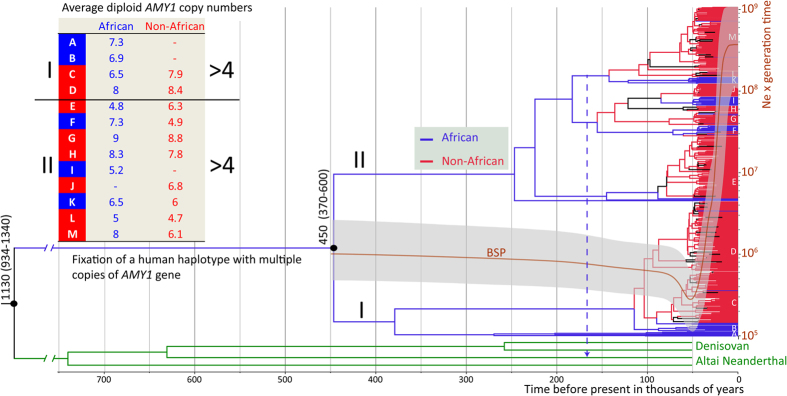
Figure 3. Phylogenetic tree and Bayesian Skyline Plot based on the analyses of a ~66 kb region downstream of the AMY locus with BEAST.
The analyses were restricted to bi-allelic SNP variants from a ~66 kb long high LD region (Chr1:104,303,310-104,369,301) which is downstream of (centromeric to) AMY1C gene (Figure S1). Coalescent time estimates are shown near branching points and assume mutation rate of 5.5 × 10⁻¹⁰ per bp per year34. BSP–Bayesian Skyline Plot; thick brown line shows the median estimates of human effective population size (Ne) x generation time (y-axis) over time (x-axis) as estimated from the ~66 kb region data in the global sample of 480 individuals. The grey shaded area around the brown line shows the 95% higher posterior density intervals of the BSP estimates. A dotted blue arrow highlights the branch of the human phylogeny that has been the likely source of an introgression of a chunk of ~16 kb (Chr1:104,350,432-104,366,871) into the genome of the Altai Neanderthal.

