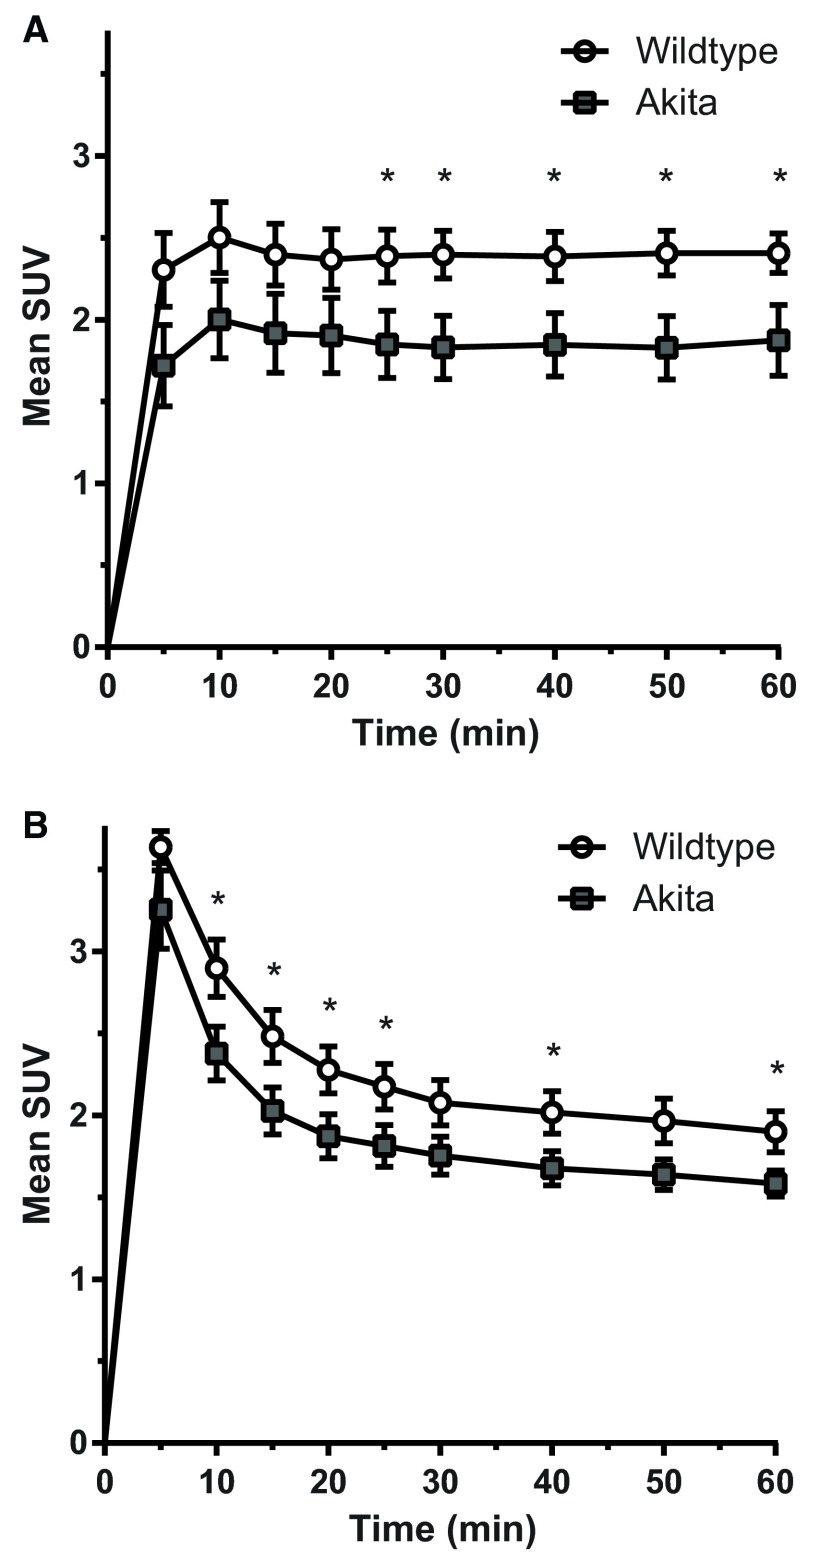
Figure 4.
Time-activity curves (TACs) for 18F-L-FEHTP uptake in the pancreas of a) pancreas and b) kidney of wt and Akita mice. TACs are expressed as SUVs from regions corresponding to regions of interest from six image slices corresponding to the areas of the kidneys and pancreas. Values are means ± SEM (n=6 for wt, n=5 for Akita). * p<0.05 compared to wt.

