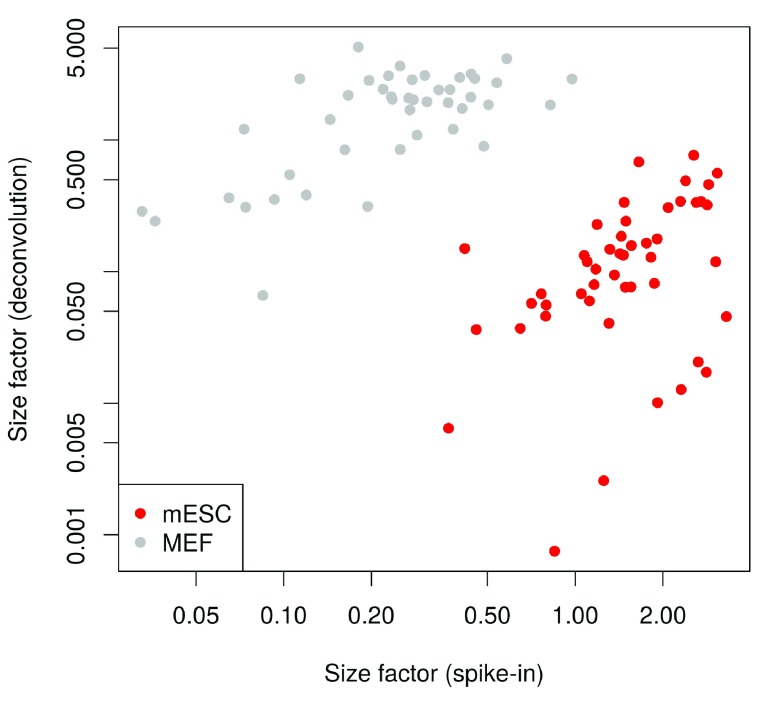
Figure 27. Size factors from spike-in normalization, plotted against the size factors from deconvolution for all cells in the mESC/MEF dataset.
Axes are shown on a log-scale, and cells are coloured according to their identity. Deconvolution size factors were computed with small pool sizes owing to the low number of cells of each type.

