
Figure 2. Total correct judgements of each externalization parameter in the reference room and the two rooms that were incongruent with the reference.
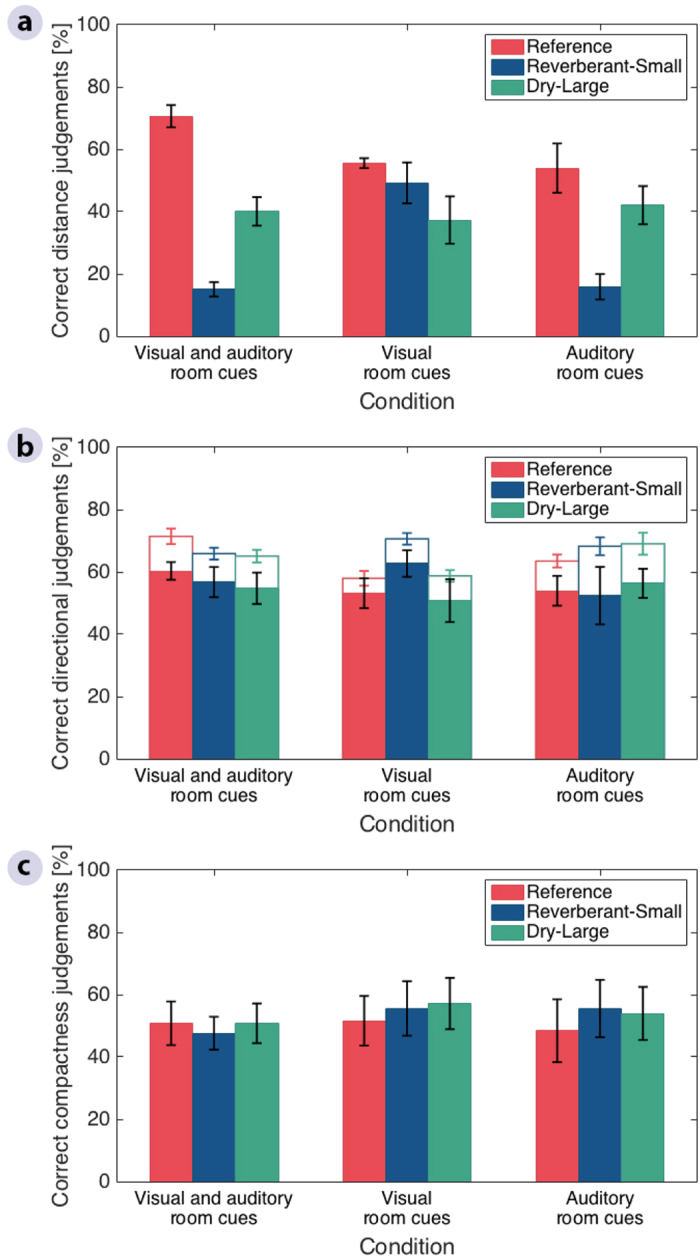
(a) Correct distance ratings. (b) Correct azimuthal direction ratings. (c) Correct compactness ratings. Percentages represent the across-listener mean calculated over the total number of correct judgements per listener across positions, while error bars show the standard error of the mean across listeners. In (b) filled bars represent percentages of correct directional judgements, while the height of empty bars represent the same percentages when counting front-back confusions as correct. Front-back confusions were determined from the number judgements in a hemisphere that differed from that of the stimulus position over the total number of presentations.