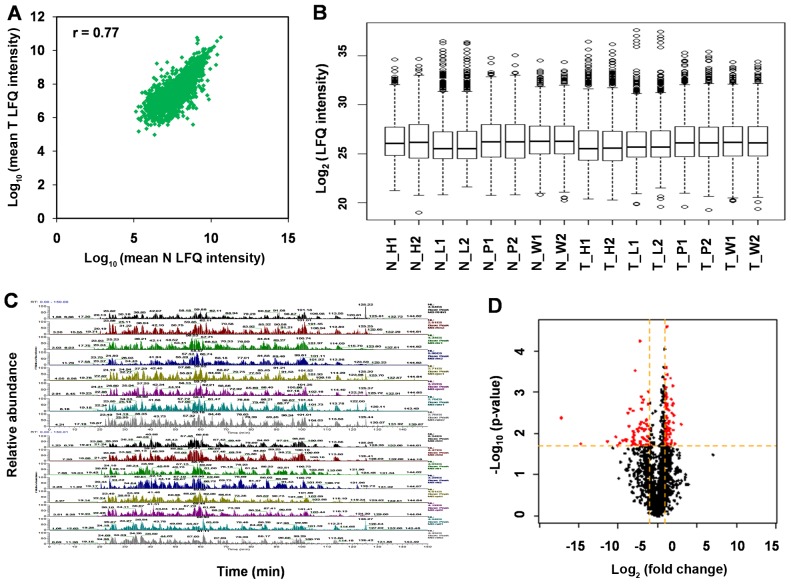
Figure 1.
Analysis of sample nano-LC-MS/MS results and method evaluation. (A) Correlation of protein abundance (LFQ intensity) between normal RCC and normal kidney tissues. (B) Box plot of protein LFQ intensities from 16 nano-LC-MS/MS analyses. (C) Base peak mass spectrograms of 16 nano-LC-MS/MS analyses. (D) Volcano plot of protein expression differences between RCC tissue and normal kidney tissues as a function of statistical significance (standard t-test, p<0.01) and log2FC >1 or <-1 as indicated in red, proteins with no statistically significant difference in expression (p>0.01) and log2FC >-1 and <1 are in black. LC-MS/MS, liquid chromatography-tandem mass spectrometry; LFQ, label-free quantification; RCC, renal cell carcinoma; FC, fold change.

