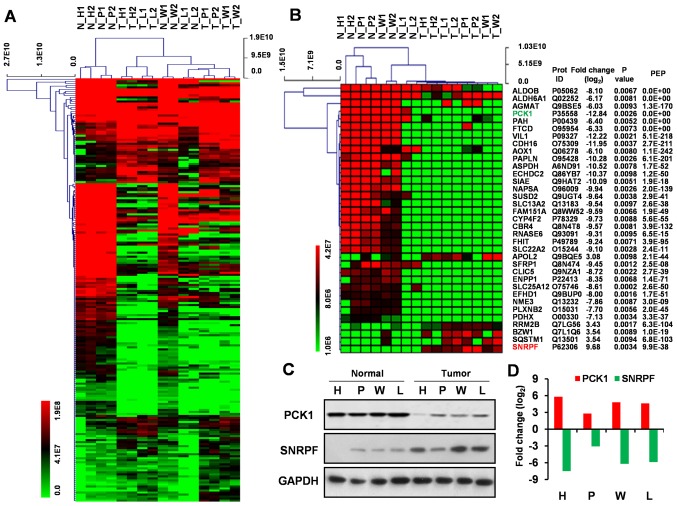
Figure 2.
Hierarchical clustering analysis and validation of differentially expressed proteins. (A) Hierarchical clustering analysis of 210 dysregulated proteins in RCC compared with the normal renal kidney tissues. (B) Hierarchical clustering analysis of the top 35 up- and downregulated proteins in RCC compared with the normal renal kidney tissues. (C) Validation of PCK1 and SNRPF expression using western blotting. Representative blots showing the expression of PCK1 and SNRPF in four RCC tumor tissues and matched normal kidney tissues. GAPDH was used as a loading control. (D) Graphical representation of the log2FC in the expression of the two proteins between four RCC tumor tissues and matched normal kidney tissue as determined by densitometry. RCC, renal cell carcinoma; FC, fold change.

