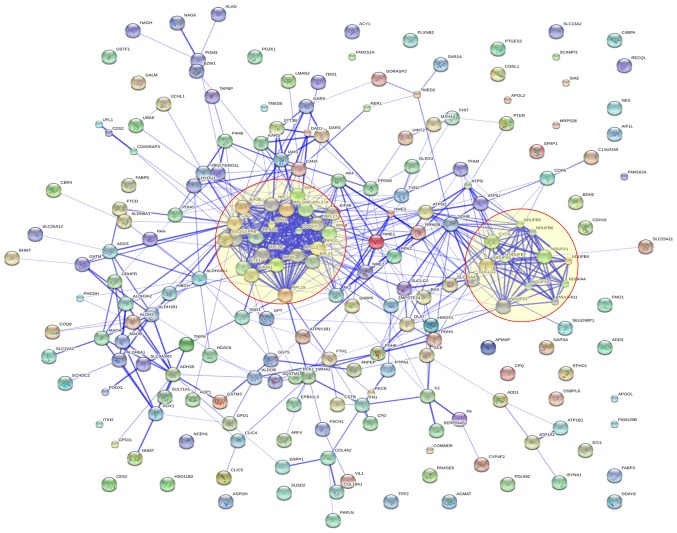
Figure 4.
Visualization of protein-protein interactions for 210 dysregulated proteins using STRING analysis. Dysregulated proteins were used as input for STRING and are shown as spheres of different colors. Blue lines stand for interactions between proteins and the thickness of the lines represents the level of confidence associated with each interaction.

