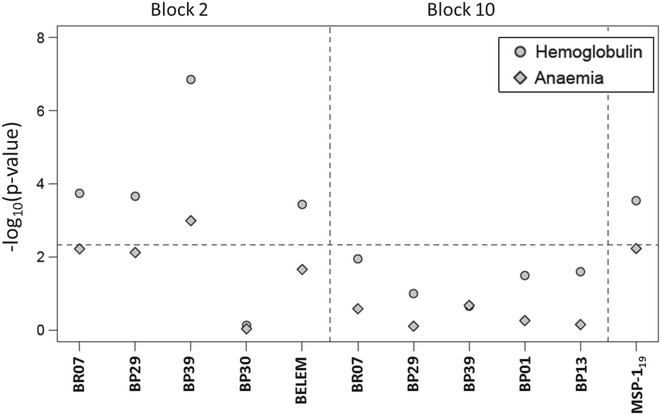
Fig. 4.

Associations between each IgG level and haemoglobin concentration (linear regression analysis) and anaemia (logistic regression model) where −log10(P value) is a measure of the strength of association and the dashed line refers to the threshold ensuring a 5% global statistical significance using the Bonferroni multiple testing correction
