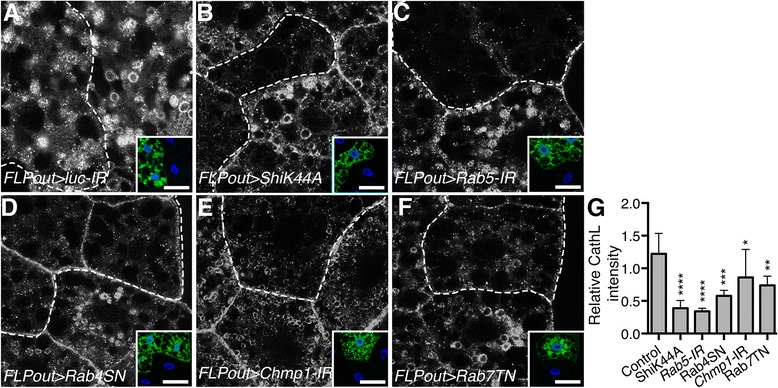
Fig. 2.

Defects in the endosomal pathway affect the distribution of the lysosomal hydrolase Cathepsin L. a-f Confocal sections of larval fat bodies with control clonal cells (a) or clonally expressing the dominant negative or silencing transgenes for Shibire (b), Rab5 (c), Rab4 (d), Chmp1 (e) or Rab7 (f). Fixed fat bodies were stained for the endogenous lysosomal hydrolase Cathepsin L. Clonal cells are outlined with a dotted line using the GFP-LAMP1 reporter also expressed by these cells as shown in the inset. Scale bar: 10 μm. g Quantification of the mean relative intensity of the Cathepsin L staining in transgene expressing cells compared to the staining intensity of the adjacent wild-type neighboring cells. Bars denote mean ± s.d. Statistical significance was determined using one-way ANOVA: *p < 0.05, **p < 0.005, ***p < 0.0005, ****p < 0.0001. Genotypes: a y w hs-FLP/UAS-ShiK44A; UAS-GFP-LAMP1/+; Ac > CD2 > Gal4/UAS-lucIR, b y w hs-FLP/UAS-ShiK44A; UAS-GFP- LAMP1/+; Ac > CD2 > Gal4/ UAS-ShiK44A, c y w hs-FLP/+; UAS-GFP-LAMP1/+; Ac > CD2 > Gal4/UAS-Rab5-IR, d y w hs-FLP/+; UAS-GFP-LAMP1/+; Ac > CD2 > Gal4/UAS-Rab4SN, e y w hs-FLP/+; UAS-GFP-LAMP1/+; Ac > CD2 > Gal4/UAS-Chmp1-IR, f y w hs-FLP/+; UAS-GFP-LAMP1/UAS-Rab7TN; Ac > CD2 > Gal4/+
