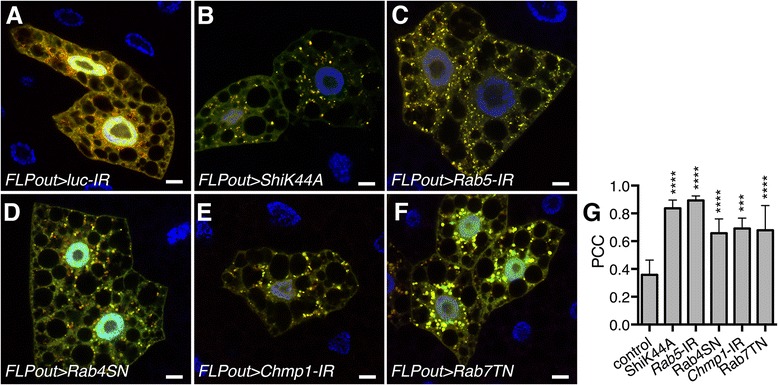
Fig. 4.

Defects in the endosomal pathway result in a blockade of the autophagy flux. a-f Confocal sections of larval fat bodies clonally expressing the autophagy flux marker GFP-mCherry-Atg8a (green) alone (a) or in combination with the dominant negative or silencing transgenes for Shibire (b), Rab5 (c), Rab4 (d), Chmp1 (e) or Rab7 (f). Fixed fat bodies were stained with Hoechst (blue). Scale bar: 10 μm. g Quantification of the colocalization of mCherry and GFP signals using the Pearson’s correlation coefficient (PCC). Bars denote mean ± s.d. Statistical significance was determined using one-way ANOVA: *p < 0.05, **p < 0.005, ***p < 0.0005, ****p < 0.0001. Genotypes: a y w hs-FLP/+; UAS-GFP-mCherry-Atg8a/+; Ac > CD2 > Gal4/UAS-lucIR, b y w hs-FLP/UAS-ShiK44A; UAS-GFP-mCherry-Atg8a/+; Ac > CD2 > Gal4/ UAS-ShiK44A, c y w hs-FLP/+; UAS-GFP-mCherry-Atg8a/+; Ac > CD2 > Gal4/UAS-Rab5-IR, d y w hs-FLP/+; UAS-GFP-mCherry-Atg8a/+; Ac > CD2 > Gal4/UAS-Rab4SN, e y w hs-FLP/+; UAS-GFP-mCherry-Atg8a/+; Ac > CD2 > Gal4/UAS-Chmp1-IR, f y w hs-FLP/+; UAS-GFP-mCherry-Atg8a/UAS-Rab7TN; Ac > CD2 > Gal4/+
