
Fig. 5.
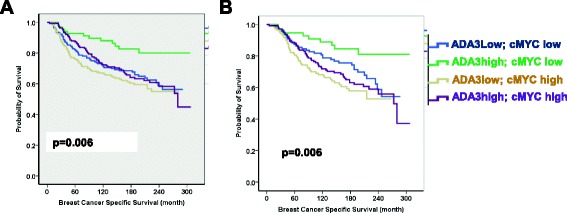
Kaplan Meier plots of nuclear ADA3 and nuclear c-MYC co-expression. Different combinatorial phenotypic groups were categorized; ADA3Low/c-MYCLow; ADA3High/c-MYCLow; ADA3Low/c-MYCHigh; ADA3High/c-MYCHigh as indicated with different colors. a in the whole series of breast cancer patients (n = 588 cases) with respect to breast cancer specific survival (BCSS) for 300 months b. Kaplan–Meier plot of nuclear ADA3 and nuclear c-MYC co expression combinatorial phenotypic groups within ER + ve tumors only (n = 432 cases) breast cancer patients with respect to BCSS