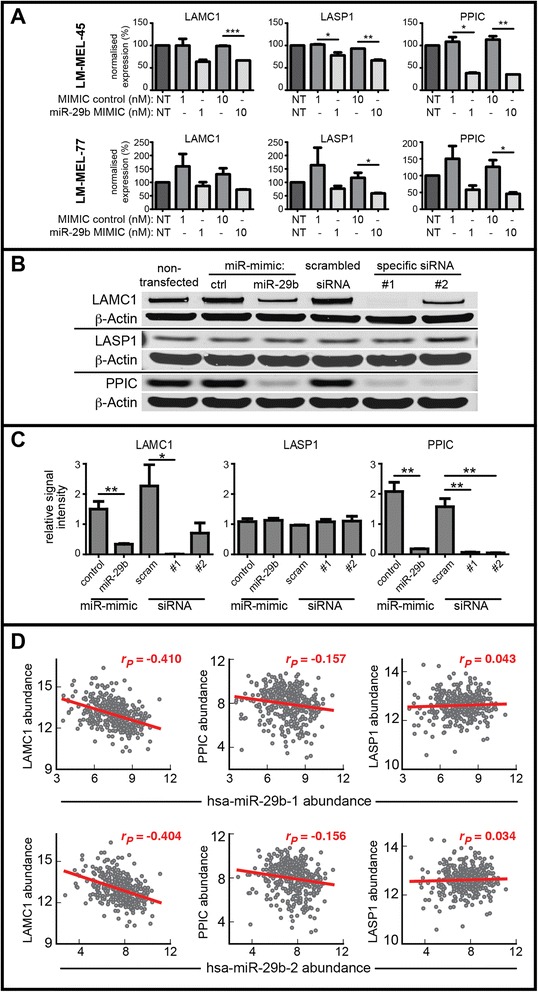
Fig. 4.

The effects of hsa-miR-29b transfection on mRNA transcript and protein levels for putative targets: LAMC1, LASP1 and PPIC. a For LM-MEL-45 and −77 (upper and lower row, respectively), two mesenchymal-like cell lines, mRNA transcript levels were measured following transfection with hsa-miR-29b mimic. Expression has been normalised to non-transfected (NT) controls. Data represent mean + SD from independent biological duplicates performed in technical triplicates. b Representative Western blots and (c) quantified densitometry for LM-MEL-45 cell lysate harvested 96 h post-transfection with 10nM of miR-29b mimic, miR mimic negative control (ctrl), siRNA scrambled (scram) control, or specific siRNA to the indicated mRNA target. Densitometry data represent mean + SEM signal intensities for independent triplicates normalised against a β-actin loading control, and shown relative to non-treated cells. Pairwise one-tailed t-test statistics are indicated by * p < 0.05, ** p < 0.01, *** p < 0.001. d Relationships between miR-29b-1 and miR-29b-2 (immature -3p precursors), and LAMC1 (at left) LASP1 (at centre) and PPIC (at right) within TCGA SKCM data. Pearson’s correlations and the line of best fit are shown in red
