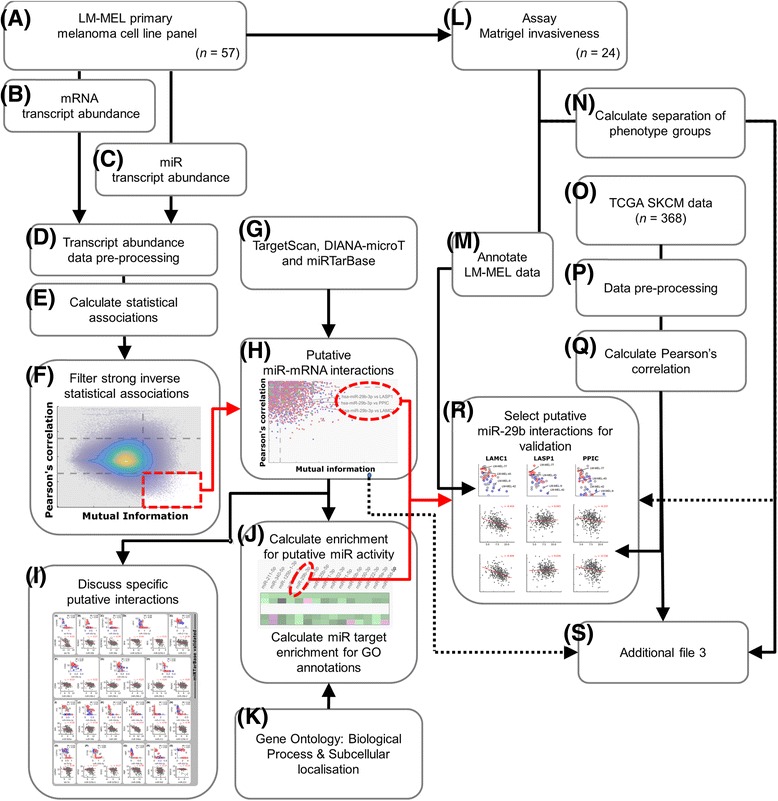
Fig. 6.

Computational workflow overview. a 57 melanoma cell lines derived (b) underwent mRNA and c miR transcript abundance profiling. d The data were processed and (e) measures of statistical association were calculated between miR and mRNA transcripts, across the LM-MEL panel data. f Strong, negative (inverse) associations (Fig. 1a) were filtered and (g) predicted interactions from TargetScan and/or DIANA-microT, and validated interactions from miRTarBase (h) were matched to provide a list of putative melanoma-relevant associations (Fig. 1b). i A number of interesting putative relationships were examined in further detail (Fig. 2). Enrichment of (j) miR-target associations within our list, and (k) Gene Ontology annotations associated with epithelial-mesenchymal plasticity or melanogenesis/pigmentation were calculated (Fig. 3a). l Independent phenotypic (invasiveness) data were used to (m) annotate results and (n) identify putative miR-mRNA relationships which separated invasiveness groups. o Samples from the TCGA melanoma data were (p) processed and matched allowing (q) Pearson’s correlation between miRs and mRNAs in vivo, to be calculated. r miR-29b-3p appeared to have a novel role regulating melanoma invasiveness, and several putative relationships were validated experimentally (Figs. 3b & 4). s All putative relationships are listed within Additional file 3. Please refer to the main text for details
