
Fig. 5.
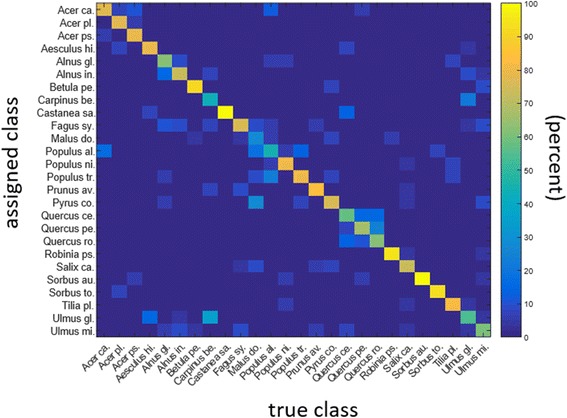
Confusion matrix showing the true class (x axis) and the class assigned by the system (y axis), at the 10-image minimum per category. The color-coding is explained to the right and refers to the percentage correctly identified
Official websites use .gov
A
.gov website belongs to an official
government organization in the United States.
Secure .gov websites use HTTPS
A lock (
) or https:// means you've safely
connected to the .gov website. Share sensitive
information only on official, secure websites.
Confusion matrix showing the true class (x axis) and the class assigned by the system (y axis), at the 10-image minimum per category. The color-coding is explained to the right and refers to the percentage correctly identified