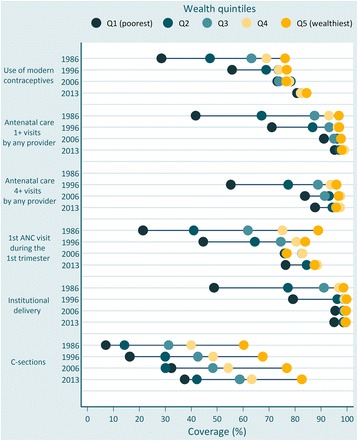
Fig. 4.

Coverage of six reproductive and maternal interventions by wealth quintiles, Brazil, from 1986 to 2013. Source: Brazil DHS 1986, DHS 1996, PNDS 2006, PNS 2013. Coloured dots show the average coverage in each wealth quintile. Q1 is the 20 % poorest wealth quintile; Q5 is the 20 % richest. The distance between quintiles 1 and 5 represents absolute inequality
