
Fig. 1.
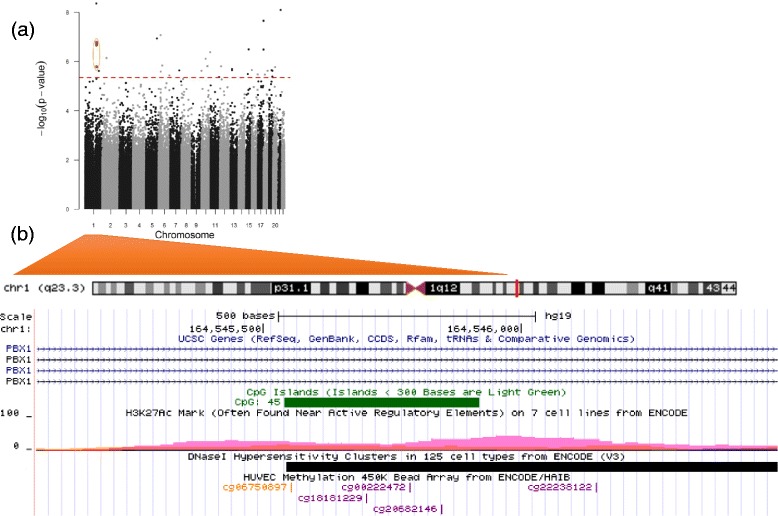
a Manhattan plot for the association of birth weight-for-gestational age (BW/GA) with epigenome-wide cord blood DNA methylation (circled orange dots indicate the PBX1 CpGs: cg18181229, cg06750897, cg00222472, cg20682146). b Magnified depiction of the PBX1 gene region within chromosome 1, with annotated genomic tracks: CpG-island location (green box), H3K27Ac histone mark enrichment levels (rainbow-colored peaks), Dnase-hypersensitivity areas (black and gray boxes), genomic location of PBX1 CpGs corresponding to orange dots in (a). Region plot in (b) adapted from UCSC genome browser