
Fig. 4.
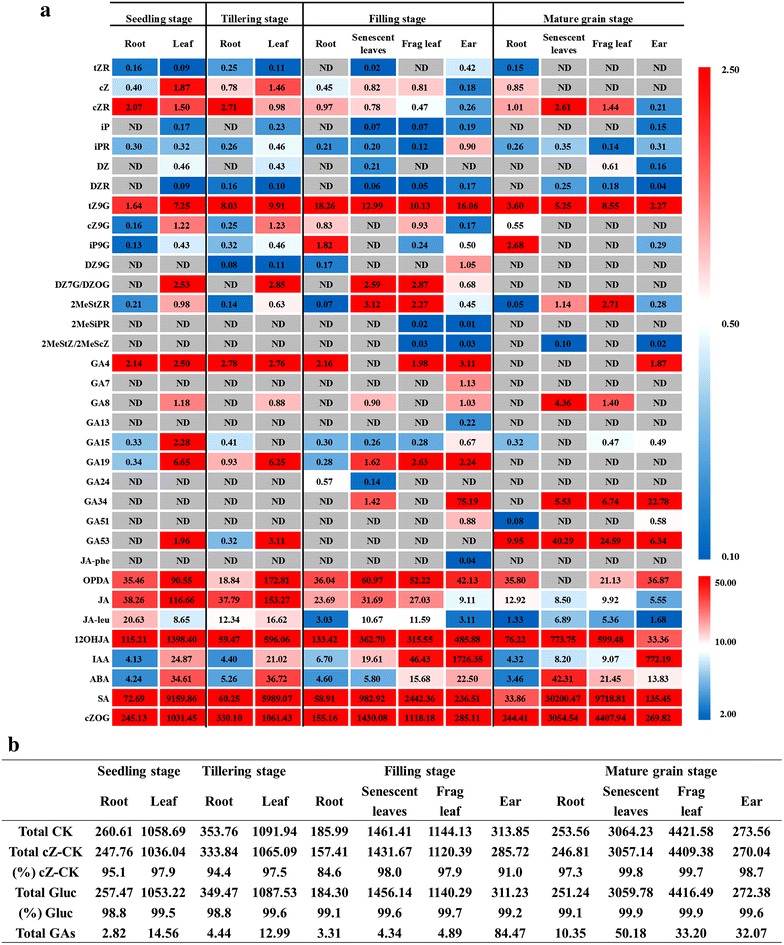
Spatiotemporal distribution of phytohormones in rice. a Heat map of spatiotemporal distribution of phytohormones. Red and blue colors indicate higher and lower concentrations, respectively. The color scale is shown at the right. Phytohormone species whose concentrations were under the quantification limit in all organs are not shown in the heat map. The value in each block is the concentration (average value, n = 3) as ng g−1 FW. ND not detected under the quantification limit. See Additional file 1: Table S6 for original data of measurement results. b Total amount of cytokinins (Total CK), cZ-type cytokinins (Total cZ-CK), cytokinin glucosides (Total gluc), and gibberellins (Total GAs) in the results of A are shown as ng g−1 FW. The proportions of cZ-type cytokinins [(%) cZ-CK] and cytokinin glucosides [(%) Gluc] are indicated as percentage values