Fig. 3.

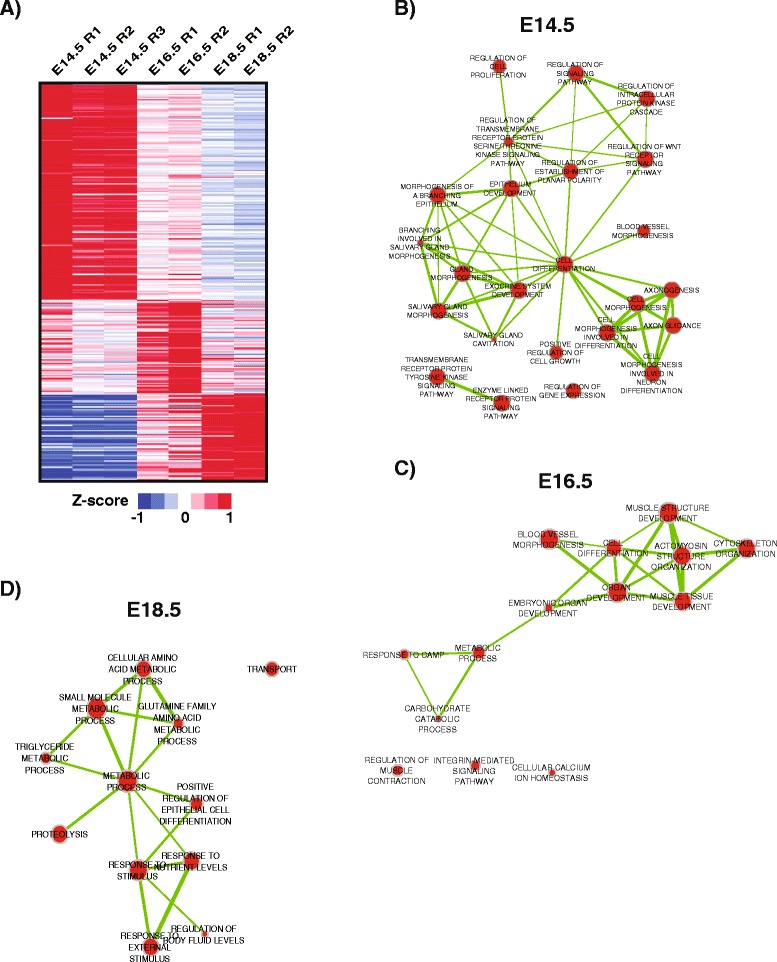
Enriched biological process networks during embryogenesis. a Heatmap visualization of the Z-scores from the 1064 genes identified in the embryo specific (E14.5, E16.5, E18.5) clusters generated from the analysis in Fig. 2. b–d) Network visualization of selected top enriched biological processes (BiNGO, Hypergeometric Test, FDR < 0.1) at E14.5, E16.5 and E18.5. The networks were assembled by CytoScape tool EnrichMap, using an organic layout. The node size represents the number of genes assigned to a biological process and edge width (green line) is proportional to the number of overlapping genes between two nodes
