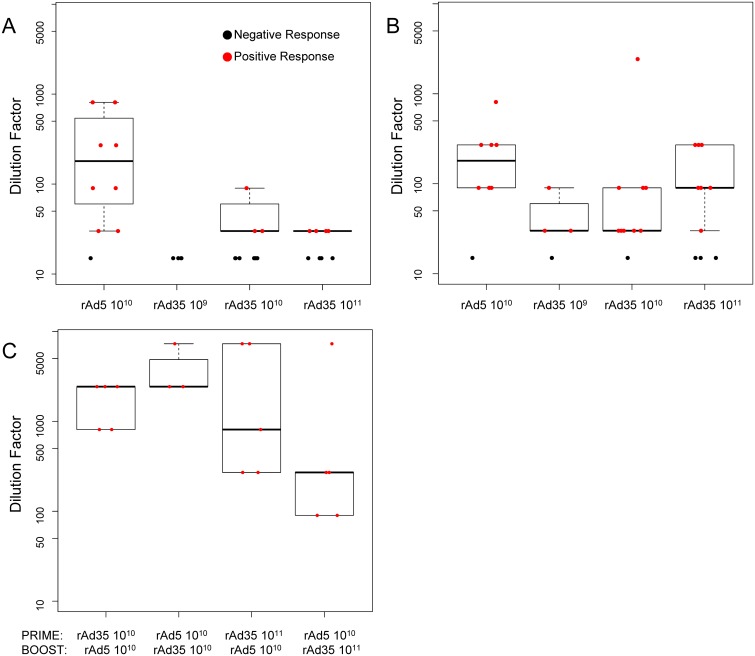
Fig 3. ELISA Responses Against EnvA Measured At Two Timepoints Post Prime and Four Weeks Post Boost.
Endpoint titers/dilution were calculated after priming by vaccine and dose indicated on the X-axis (A & B), combined from Parts I and II, and each individual prime-boost combination indicated on the X-axis from Part II (C). Part A shows data 4 weeks post prime, while 4B shows data 12 weeks post prime. Part C shows data 4 weeks post boost. The responders are represented on the plot with red dots and are used to construct the boxplots showing the interquartile range; black dots represent the non-responders and are not included in the response range.

