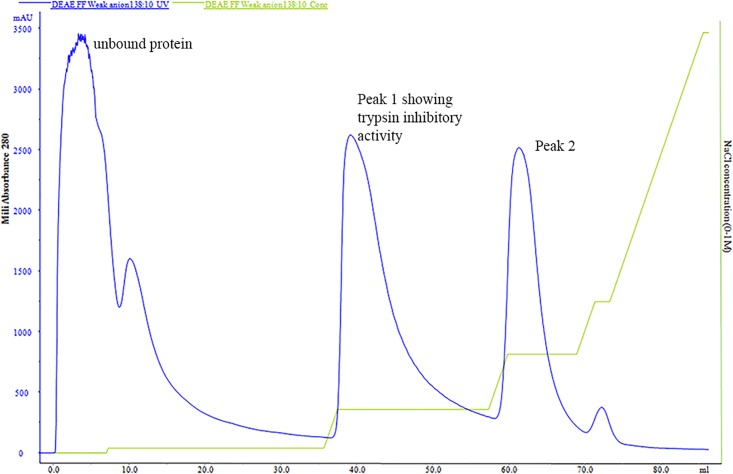
Fig 1. FPLC chromatogram of ASPI after ammonium sulphate saturation and dialysis, the sample was loaded on Hi Trap DEAE FF column and eluted using gradient of NaCl (0–100% in Tris buffer).
The chromatogram represents concentration of ASPI eluted (milliabsorbance mA280 at 280 nm) on Y axis with amount of eluted fraction (ml) on Y axis. The second curve represents the gradient of NaCl (0–100% of B) where buffer A is 25 mM Tris–HCl (pH 8.2) and B is 1.0 M NaCl in the same buffer.

