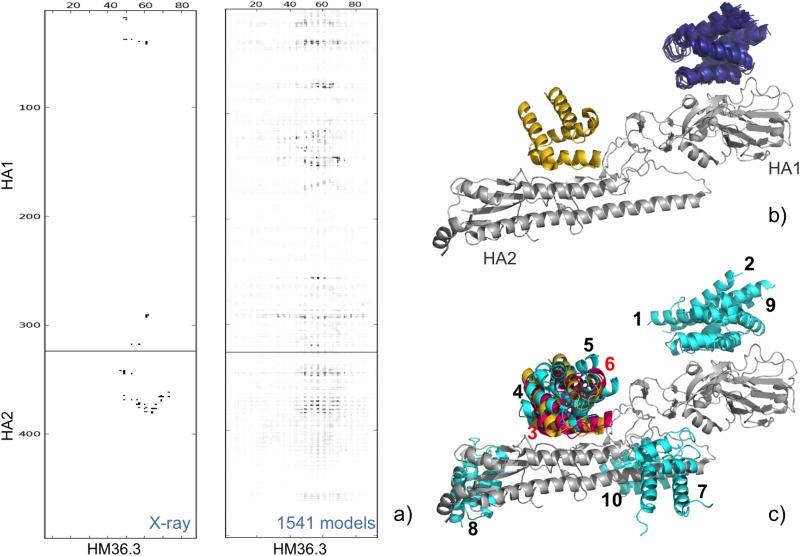
Fig 2. T50 scoring.
(a) X-ray structure contact map obtained by COCOMAPS [28] (left) and consensus map from the 1451 available models (right). (b, c) 3D representation of the T50 target experimental structure and of selected models by CONSRANK (b) and by Clust-CONSRANK—MC/10 (c). X-ray receptor and ligand are colored silver and gold, respectively. Ligands of models selected by CONSRANK are colored deep blue, while incorrect and correct solutions selected by MC/10 are colored light blue and hot pink, respectively.

