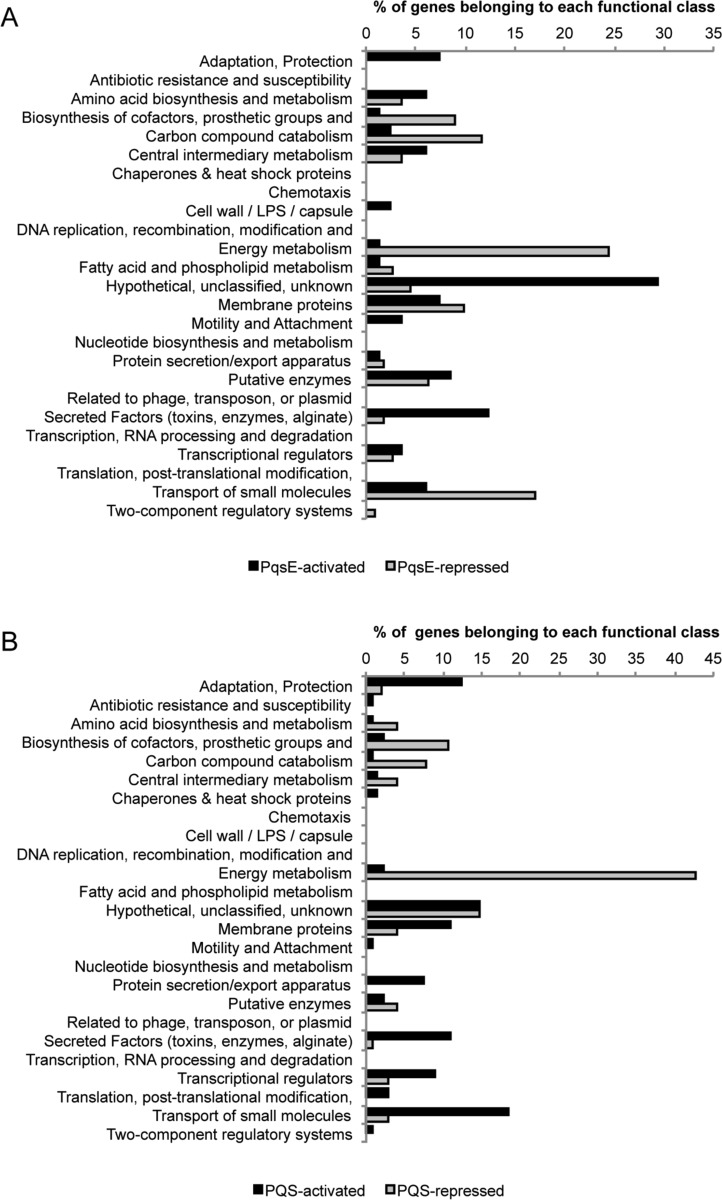
Fig 3. Functional classes of PqsE and PQS controlled genes.
Histograms representing the distribution of (A) PqsE-controlled and (B) PQS-controlled genes according to their functional classification. Functional classes are from the Pseudomonas Genome Database [13].

