
Fig 5. Interplay of HHQ, PQS, PqsR and iron in controlling PpqsA and PpqsR activity.
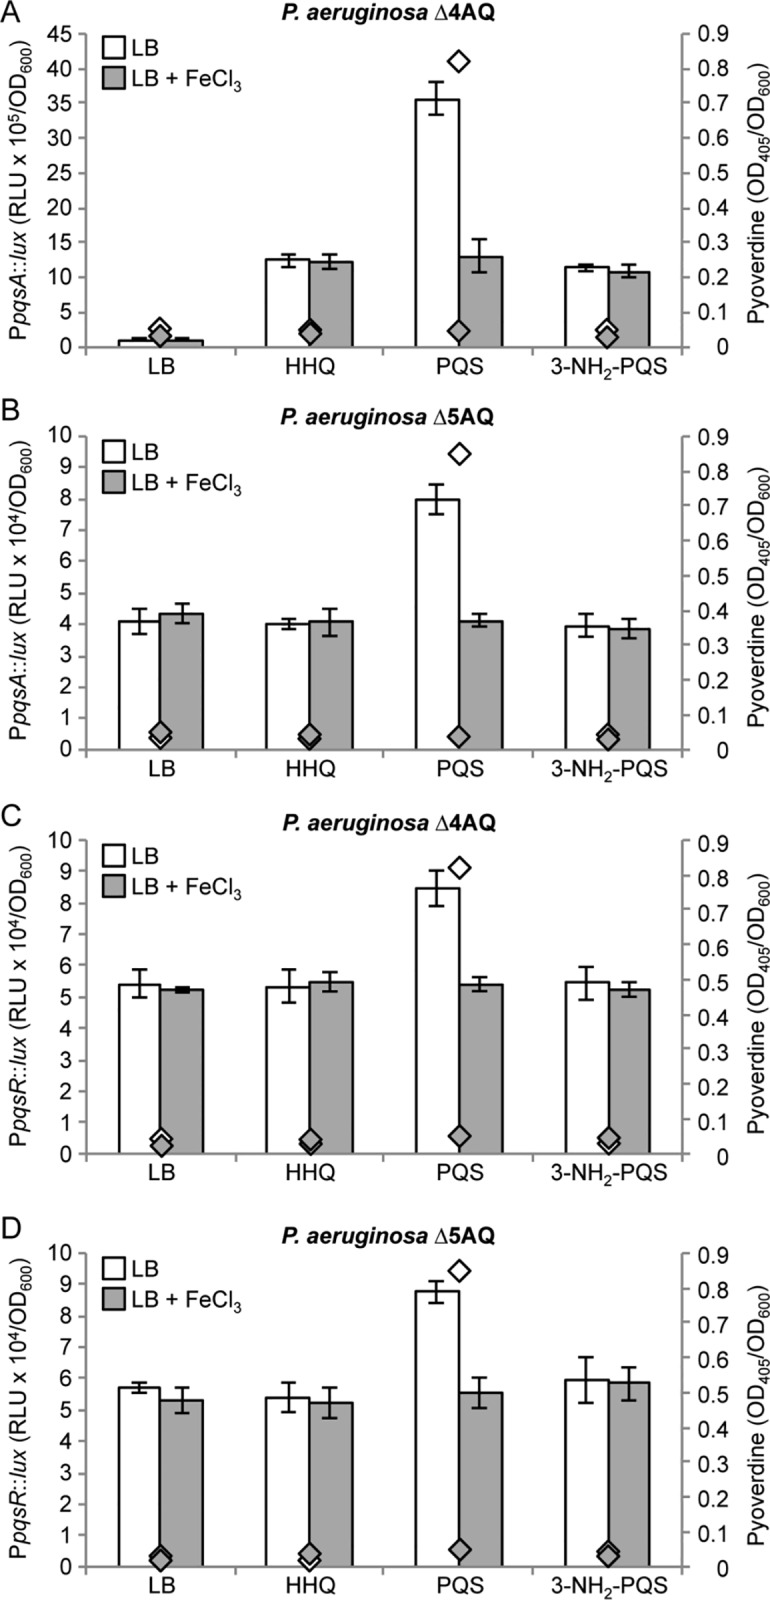
Maximal promoter activity quantified in the indicated strains carrying the transcriptional fusions PpqsA::lux (A and B) or PpqsR::lux (C and D). Strains were grown in LB or in LB supplemented with 40 μM HHQ, PQS or 3-NH2-PQS, as indicated below the graphs, in the absence (white bars) or presence (grey bars) of 100 μM FeCl3. Diamonds indicate the pyoverdine levels in the absence (white diamonds) or in the presence (grey diamonds) of 100 μM FeCl3. Promoter activity and pyoverdine level are reported as Relative Light Units (RLU) and OD405, respectively, normalized to cell density (OD600). The average of three independent experiments is reported with standard deviations.