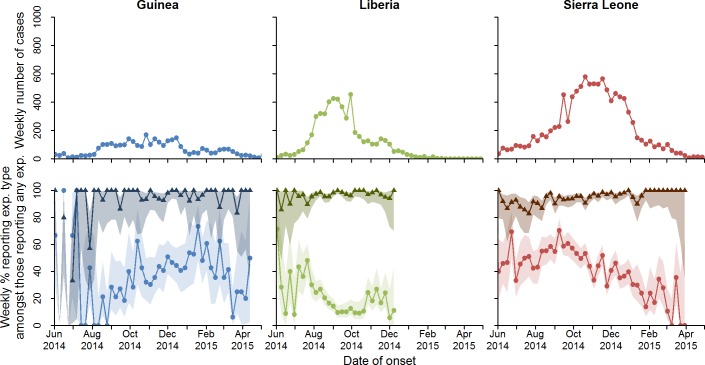
Fig 1. Total number of confirmed and probable cases by week, and percentage who reported funeral and non-funeral exposures.
Total number of confirmed and probable cases by week is shown in the top row. Percentage of cases who reported a non-funeral exposure (triangles) or a funeral exposure (circles) is shown in the second row. The shaded regions represent the 95% confidence intervals around the proportions. Note that cases can report more than one exposure, and so percentages need not add to 100%. exp., exposure.

