

Abstract
Chronic obstructive pulmonary disease (COPD) is a heterogeneous disease having small airway inflammation, emphysema, and pulmonary hypertension. It is now clear that spirometry alone cannot differentiate each component. Quantitative computed tomography (QCT) is increasingly used to quantify the amount of emphysema and small airway involvement in COPD. Inspiratory CT guides in assessing emphysema while expiratory CT identifies areas of air trapping which is a surrogate of small airway inflammation. By constructing a three-dimensional model of airways, we can also measure the airway wall thickness of segmental and subsegmental airways. The aim of this review is to present the current knowledge and methodologies in QCT of the lung that aid in identifying discrete COPD phenotypes.
KEY WORDS: Airway wall thickening, chronic obstructive pulmonary disease, imaging, physiopathology, pulmonary emphysema, quantitative computed tomography
INTRODUCTION
The global initiative for chronic obstructive lung disease (GOLD) defines chronic obstructive pulmonary disease (COPD) as a common preventable and treatable disease characterized by persistent airflow limitation that is usually progressive and associated with enhanced chronic inflammatory response in the airways and lung to noxious particles or gases. Co-morbidities and exacerbations contribute to overall severity in individual patients.[1] The diagnosis of COPD is based on GOLD guidelines where postbronchodilator forced expiratory volume in 1 s (FEV1)/forced vital capacity (FVC) is <0.70. However, COPD is a heterogeneous disease with varying amount of emphysema and small airway inflammation. Spirometry may not capture the heterogeneity of the disease completely.[2] Individuals with similar FEV1 may have substantial, little or no emphysema and Makita et al. showed that emphysema extent varies widely within the same disease stage.[3]
COPD affects the small airways, lung parenchyma, and pulmonary vasculature leading to small airway inflammation, emphysema, and pulmonary hypertension. Pulmonary emphysema is defined as permanent enlargement of airspaces distal to terminal bronchiole with the destruction of alveolar walls and loss of alveolar attachments. Emphysema can be centrilobular, panlobular, and paraseptal. These pathological changes are visualized by conventional chest X-rays in severe COPD or when there are large emphysematous bullae. The early changes are neither sensitive nor specific to COPD on chest X-ray.[4,5]
Multidetector computed tomography (MDCT) scanners provide noninvasive methods to study the lung pathology in COPD. Quantitative methods based on CT are available to quantify emphysema and airway dimensions[6] and a consistent body of literature suggests that CT represents an important tool in a clinical setting helping to accurately detect the location, quantify the extent, and severity of emphysema,[7,8,9] as well as small airway disease (SAD). This body of evidence has promoted the use of thoracic CT and is now considered an indispensable technology for longitudinal analysis and intervention trial of α1 antitrypsin deficiency[10] and severe emphysema.[11]
METHODS
We searched MEDLINE via PubMed, PubMed Central, and Cochrane Library from 1960 to 2015 using search items related to COPD (COPD, chronic obstructive lung disease, pulmonary disease, and chronic obstructive) and radiology, imaging, CT, physiopathology, and pathology. We included review articles, original articles, editorials, and letters to the editor published in English language. We retrieved 2330 articles; of these 443 were free full-text articles and 1406 abstracts. We had access to 543 articles, and the review is based on these available literatures.
EMERGENCE OF COMPUTED TOMOGRAPHY IN ASSESSING EMPHYSEMA
In the 1980's Hayhurst et al. were first to quantify emphysema severity with CT and showed that Hounsfield units (HUs) frequency distribution curves of patients with histologically proven emphysema differed significantly from patients without emphysema.[12] During this time, the images were 10 mm in thickness, and they appeared blurry because of averaging of structures within the slice.[13] With MDCT scanners, thinner slice images of 0.5–1 mm of the entire lung are achievable within a single breath hold of 5–15 s which is referred to as volumetric CT or quantitative CT (QCT). On inspiratory CT, normal lung attenuation is about − 850 HU while air-containing spaces have an attenuation of − 1000 HU. Now with the development of computer-aided automated analytical software we can visualize the airways, vessels, and accurately measure lung density.[14]
The extent of emphysema is estimated using the density mask. The density mask method was introduced in 1988 and is based on a predefined voxel as a threshold to differentiate between areas of normal attenuation values and areas of low attenuation (LAA).[15] The two-dimensional (2D) picture element, called pixel, has the third dimension due to the thickness of the CT slice. This gives volume to a pixel and hence is called a voxel. The CT voxels are measured by their attenuation values in HUs. The mean lung density is the mean of the HU measured. The density mask technique is defined as the percentage of LAA of total lung volume that contains voxels of attenuation value <−950 HU on inspiratory scans (proportion of lung parenchyma with attenuation values lower than a predetermined threshold). This type of densitometry analysis has been found to correlate with lung function.[16] Gevenois et al. reported the strongest pathological correlation with emphysema at macroscopic[17] and microscopic[18] level, at −950 HU on 1 mm noncontrast enhanced high resolution filtered images. Although the highest correlation between QCT metrics and histology was found when CT threshold was set at −960 or −970 HU,[6] a value of −950 HU is selected to balance sensitivity and specificity.[19,20,21]
There is another method to quantify emphysema which is the 15th percentile cut off on the attenuation distribution curve called Perc15. This provides the HU under which 15% of voxels are distributed.[22,23] There is evidence that the percentile approach is more robust for longitudinal studies and is less sensitive to changes in lung volume.[24] It is observed that the first percentile has a better histological correlation, but many studies use the 15th percentile threshold due to artifacts from image noise and truncation artifacts at the first percentile.
Software available on most MDCT scanners makes evaluation faster and easier. We can now measure the total lung volume, right and left lung volume, mean lung density, the 15th percentile of lung density, the percentage of low attenuation regions, emphysema cluster analysis, core and peel involvement, regional distribution of emphysema, airway wall morphology, gas trapping, pulmonary vessel morphology, and coronary calcifications.
Densitometric analysis, however, cannot differentiate between centrilobular, panlobular, paraseptal, and bullous emphysema. This analysis is carried out by visual scoring (qualitative) but has inter- and intra-observer variability.[25] Quantitative scores are preferred over visual scores as a quantitative assessment of emphysema gives a continuous score rather than categorical as in qualitative analysis.[26] Quantitative scores help in disease follow-up, and emphysema quantification has been shown to be highly reproducible.[27,28]
CT can detect emphysema even before the patient becomes symptomatic or is proven by spirometry. Remy-Jardin et al. showed that in smokers who had lobe resection done for lung nodule, there was a high incidence of emphysema seen in the pathological specimen even without any clinical symptoms or obstruction of airways.[29] Early emphysema is usually asymptomatic for a long time, and >30% of total lung parenchyma has to be destroyed for the manifestation of clinical symptoms or changes in pulmonary function tests.[30]
TECHNIQUE FOR QUANTITATIVE COMPUTED TOMOGRAPHY OF LUNG AND QUALITY CONTROL
Many large-scale clinical studies that investigate the effect of smoking on lung have incorporated QCT into their trial protocol. These include genetic epidemiology of COPD (COPD Gene),[20] Multi-Ethnic Study in Atherosclerosis,[31] Subpopulations and intermediate outcome measures in COPD,[32] Evaluation of COPD longitudinally to identify predictive surrogate endpoints,[33] and Can COLD study.[34] The severe asthma research program also uses QCT to study large and small airways in severe asthma.[35]
To study emphysema and airway wall thickening on CT, the lung is scanned from apex to base in full inspiration (total lung capacity). Madani et al. showed that measures of emphysema changed when scans were performed at 100%, 90%, 80%, 70%, and 50% of vital capacity but there was minimal change between 90% and 100%.[36] The largest variation in lung attenuation is driven by the ability of the patient to inspire or expire at the given lung volumes, maintain that volume for the duration of scan, 12 s or less and not move during the scan.[37] For this the patient has to be coached by the CT technologist, ensuring that the patient has taken and maintains a deep inspiration. The scan time should be as short as possible, and this is achieved by minimizing the gantry rotation time, having maximum number of channels present and highest pitch which is a function of table speed and gantry rotation time. The pitch is set no >1 and rotation time no >0.5 s. The mAs delivered is adjusted based on the subject's body mass index. Patients must be centered within the CT scanner gantry. Optimal reconstruction kernel must be used. Visual assessment and quantification of emphysema is possible on the thin CT reconstruction of 1.25 mm or less thickness images.
Expiratory scans are obtained at functional residual capacity.[20] Expiratory images are used to quantify air trapping due to SAD in COPD. There are some studies which perform an expiratory scan at residual volume[33] but it is not clear which technique is better. Areas of air trapping on the expiratory scan are defined at HU <−856. This value is chosen as it is normal attenuation of the lung in inspiration and it is assumed that normal expiratory lung should have higher attenuation than −856 HU.[38] The percentage low attenuation volume at −856 HU shows high correlation (r = 0.85–0.90) to FEV1/FVC, and FEV1 percent predicted.[39,40] However, simple air trapping cannot differentiate between air trapping due to SAD or emphysema. Parametric response mapping (PRM) is a technique that differentiates emphysema and SAD from within regions of the lung identified by QCT as air trapping.
There is a concern for radiation dose in QCT. The Radiological Society of North America's Quantitative Imaging Biomarker Alliance aims to improve the value and practicality of quantitative imaging. To address this in longitudinal studies, iterative reconstruction methods are used. Hence, a lower dose can be used to generate images. Currently, the iterative reconstruction algorithms enable dose reduction ranging from 20% to 80%.[41] It is important to remember that reconstruction methods affect the quantitative measurement of emphysema and air trapping, hence, the same reconstruction algorithm and protocol must be followed throughout the course of study and in longitudinal studies requiring repeat scans.[42]
QUANTITATIVE COMPUTED TOMOGRAPHY OF LUNG ANALYSIS BY PARAMETRIC RESPONSE MAPPING
PRM method is a unique quantitative assessment of CT images.[43] It involves three fundamental steps. First is inspiratory and expiratory image acquisition, image processing which involves lung parenchymal segmentation and co-registration of inspiratory and expiratory scans digitally and finally classification of voxels on Hounsfield values where green represents normal lung parenchyma, yellow is functional SAD (fSAD), and red is emphysema. With this method, we can differentiate air trapping from emphysema and fSAD. The percentage of parenchyma <−950 HUs on the inspiratory scan is quantified as percentage of emphysema. For the assessment of SAD, PRM technique generates a map based on the assumption that voxels of lung with inspiratory CT attenuation <−950 HU are emphysema while voxels >−950 HU on inspiration, but <−856 HU on expiration are areas of gas trapping due to fSAD [Figure 1].
Figure 1.
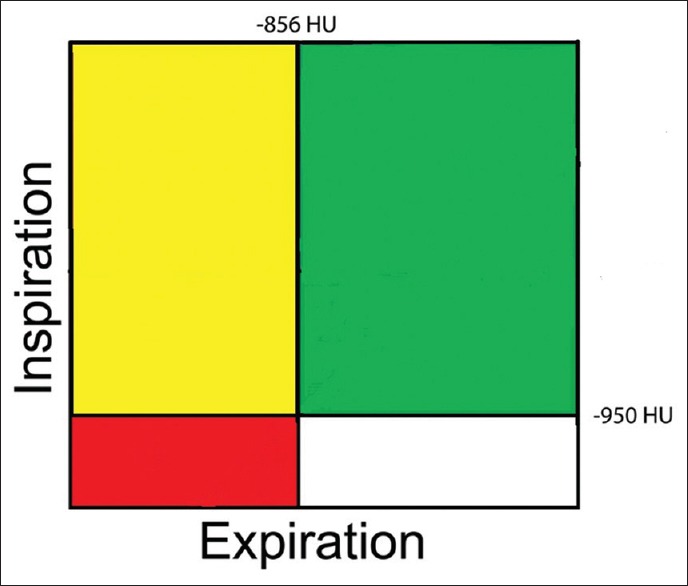
Classification of voxels by parametric response mapping. Green = Normal healthy and deforming voxels. Red = Emphysema voxels, yellow = Functional small airway disease voxels
The strength of PRM is to identify individuals with varying combination of emphysema and fSAD. Figure 2 shows how for the same severity of COPD the two individuals have varying amount of emphysema and SAD. PRM analysis could also help in individualized therapeutic interventions. Recently, it has been shown that PRM adds significantly to the diagnostic value of CT quantification methods in assessing the presence of COPD.[44]
Figure 2.

(Left to right) demonstrate the composite (PRMΣ) voxel signature in global initiative for chronic obstructive lung disease stage two patient with tobacco smoke exposure chronic obstructive pulmonary disease (top panel) and biomass smoke exposure chronic obstructive pulmonary disease (bottom panel). The colours in the two-dimensional image (top and bottom left) and three-dimensional image reconstructions (left to right) represent (i) PRMNormal: Normal healthy and deforming lung voxels (green), (ii) PRMfSAD: Functional small airways disease voxels (yellow) and (iii) PRMEmph: Emphysema voxels (red). TS-COPD and BS-COPD having similar postbronchodilator forced expiratory volume in 1 s %, (67%). Tobacco smoke associated chronic obstructive pulmonary disease PRMEmph = 6.73%, PRMfSAD = 40.36% PRMNormal = 46.48%. Biomass smoke associated chronic obstructive pulmonary disease PRMEmph = 0.39%, PRMfSAD = 69.61%PRMNormal = 21.45%
QUANTITATIVE COMPUTED TOMOGRAPHY OF LUNG ANALYSIS BY PULMO THREE-DIMENSIONAL SOFTWARE
The quantitative assessment by Pulmo 3D Software, Siemens Healthcare, Germany can quantify emphysema and various subranges of HUs as seen in Figure 3. The software measures the percentage low attenuation volume (emphysema) in total lung as well as each lung and each third of lung. It further classifies the emphysema clusters in various classes as seen in Figure 4.
Figure 3.
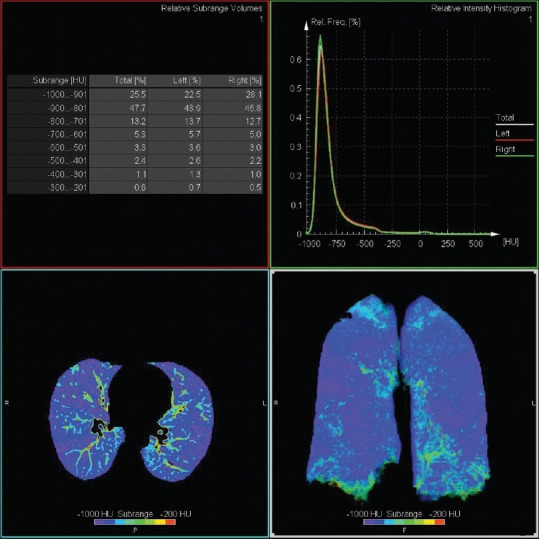
Axial and coronal density mask image giving overview of Hounsfield unit subrange distribution
Figure 4.
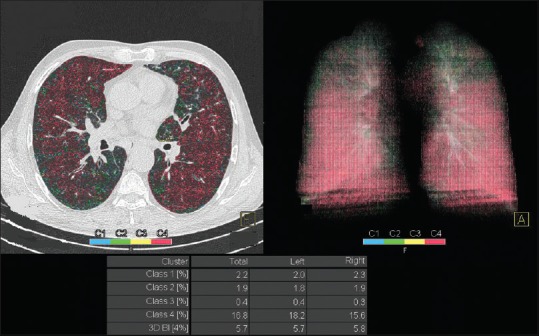
Image shows clusters of emphysema, mostly Class 4 (≥25 mm)
QUALITATIVE ASSESSMENT ON COMPUTED TOMOGRAPHY LUNG
The visual assessment of CT in COPD is done to assess the presence of emphysema, the type of emphysema, airway wall thickening, bronchiectasis, bronchiolitis, centrilobular nodules, fibrosis, and pulmonary artery size. The visual description of emphysema has inter-observer variability,[25] and it is difficult to detect the earliest form of emphysema on CT scan when the size of the lesion is <5 mm on qualitative analysis.[45] The observer agreement in the severity of emphysema on visual amount is also variable,[26] and so also with visual amount of bronchial wall thickening.[46] Figure 5 shows the presence of centrilobular and paraseptal emphysema.
Figure 5.
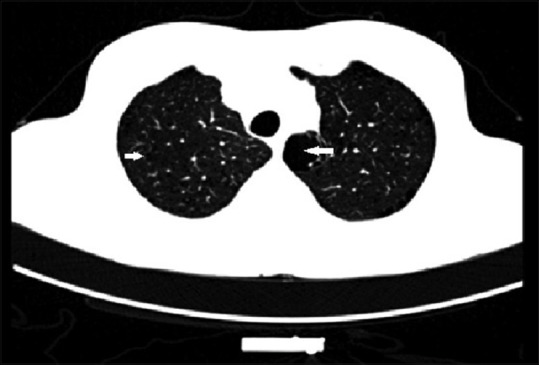
Axial computed tomography image demonstrating centrilobular (arrow) and paraseptal (thicker arrow) emphysema
ANALYSIS OF AIRWAY DISEASE
Animal studies have shown that airways are completely dilated at transpulmonary pressures of more than 10 cm of water, and hence, a reasonable inspiratory effort is adequate to compare airways.[47,48] Airways can be assessed by measuring the airway wall and lumen dimensions. The parameters measured are lumen area (Ai), internal lumen perimeter (Pi), and wall area percentage. The most widely used method for airway assessment is full- width- at- half- maximum principle; a computer-aided automated technique. It is based on the X-ray attenuation values measured along rays cast from the center of the lumen moving outward toward the airway wall in all directions. As the ray enters the wall, the attenuation increases and decreases as it passes into the lung parenchyma. The distance between the points at which the attenuation is half way to the maximum on the lumen side and halfway to the minimum on the parenchymal side is considered the wall thickness [Figure 6].[6,49]
Figure 6.
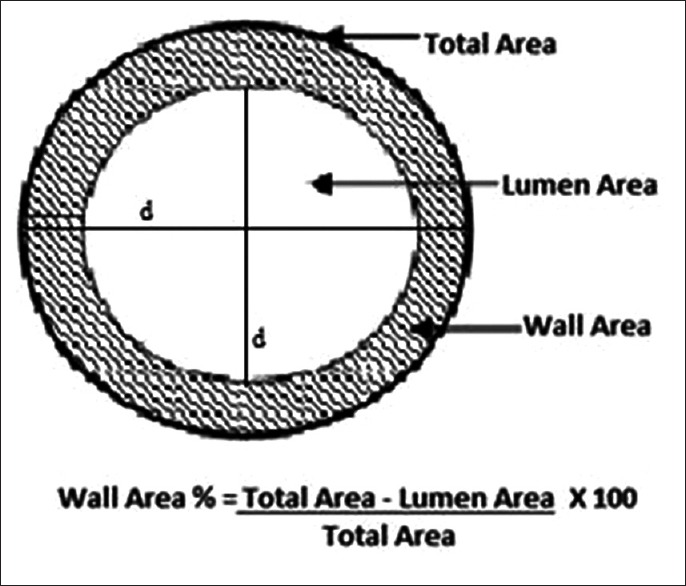
The average outer diameter for the segment is calculated and so also lumen diameter. Wall area is calculated by subtracting the lumen area from the total area. Wall area % is calculated by dividing the wall area by the total area
The commonly used summary measure of bronchial wall area is the square root of wall area of a hypothetical bronchus of internal perimeter of 10 mm called Pi10 which is derived from linear regression of all measured bronchi.[50] Pi10 provides a method for standardizing airway measurements for comparisons between subjects.
Quantitative techniques to measure airways are still in development phase. Earlier studies have shown a correlation between airway dimensions and FEV1 using cross-sectional CT images.[6,51] Nakano et al. showed that there was a correlation between wall area of small airways measured histologically and wall area of large airways measured using CT.[50] Hasegawa et al. measured airway dimensions at 5th or 6th generation and showed that correlation to spirometry improved in more distal bronchial dimensions.[51] Grydeland et al. showed that Pi10 was independently related to symptoms of a cough, wheeze, and dyspnea.[52]
CONCLUSIONS
QCT of lung provides anatomical and physiological insights into the structure and function of lung in COPD. QCT is now becoming an established tool to assess the pathological component in COPD in cross-sectional and longitudinal studies providing deeper knowledge in patient outcomes such as acute exacerbation of COPD, mortality, and quality of life. All along, the outcome of COPD treatment intervention was assessed by FEV1. Now QCT enables us to visualize and quantify the improvement in SAD and emphysema in response to bronchodilator therapy. Further, improved image reconstruction methods reduce radiation doses and hence can be used in longitudinal studies even in younger patients.
Financial support and sponsorship
Nil.
Conflicts of interest
There are no conflicts of interest.
Acknowledgment
We thank Craig J Galban, Department of Radiology, Center for Molecular Imaging, University of Michigan, Michigan, USA for permitting use of PRM images generated in TS-COPD and BS- COPD patients.
REFERENCES
- 1.Vestbo J, Hurd SS, Agustí AG, Jones PW, Vogelmeier C, Anzueto A, et al. Global strategy for the diagnosis, management, and prevention of chronic obstructive pulmonary disease: GOLD executive summary. Am J Respir Crit Care Med. 2013;187:347–65. doi: 10.1164/rccm.201204-0596PP. [DOI] [PubMed] [Google Scholar]
- 2.Agustí A, Vestbo J. Current controversies and future perspectives in chronic obstructive pulmonary disease. Am J Respir Crit Care Med. 2011;184:507–13. doi: 10.1164/rccm.201103-0405PP. [DOI] [PubMed] [Google Scholar]
- 3.Makita H, Nasuhara Y, Nagai K, Ito Y, Hasegawa M, Betsuyaku T, et al. Characterisation of phenotypes based on severity of emphysema in chronic obstructive pulmonary disease. Thorax. 2007;62:932–7. doi: 10.1136/thx.2006.072777. [DOI] [PMC free article] [PubMed] [Google Scholar]
- 4.Sutinen S, Christoforidis AJ, Klugh GA, Pratt PC. Roentgenologic criteria for the recognition of nonsymptomatic pulmonary emphysema. Correlation between roentgenologic findings and pulmonary pathology. Am Rev Respir Dis. 1965;91:69–76. doi: 10.1164/arrd.1965.91.1.69. [DOI] [PubMed] [Google Scholar]
- 5.Nicklaus TM, Stowell DW, Christiansen WR, Renzetti AD., Jr The accuracy of the roentgenologic diagnosis of chronic pulmonary emphysema. Am Rev Respir Dis. 1966;93:889–99. doi: 10.1164/arrd.1966.93.6.889. [DOI] [PubMed] [Google Scholar]
- 6.Nakano Y, Muro S, Sakai H, Hirai T, Chin K, Tsukino M, et al. Computed tomographic measurements of airway dimensions and emphysema in smokers. Correlation with lung function. Am J Respir Crit Care Med. 2000;162(3 Pt 1):1102–8. doi: 10.1164/ajrccm.162.3.9907120. [DOI] [PubMed] [Google Scholar]
- 7.Coxson HO, Rogers RM. Quantitative computed tomography of chronic obstructive pulmonary disease. Acad Radiol. 2005;12:1457–63. doi: 10.1016/j.acra.2005.08.013. [DOI] [PubMed] [Google Scholar]
- 8.Madani A, Zanen J, de Maertelaer V, Gevenois PA. Pulmonary emphysema: Objective quantification at multi-detector row CT – Comparison with macroscopic and microscopic morphometry. Radiology. 2006;238:1036–43. doi: 10.1148/radiol.2382042196. [DOI] [PubMed] [Google Scholar]
- 9.Matsuoka S, Kurihara Y, Yagihashi K, Nakajima Y. Quantitative thin-section CT analysis of the enlargement and coalescence of low-attenuation clusters in patients with emphysema. Respiration. 2007;74:136–41. doi: 10.1159/000096034. [DOI] [PubMed] [Google Scholar]
- 10.Stockley RA, Parr DG, Piitulainen E, Stolk J, Stoel BC, Dirksen A. Therapeutic efficacy of α-1 antitrypsin augmentation therapy on the loss of lung tissue: An integrated analysis of 2 randomised clinical trials using computed tomography densitometry. Respir Res. 2010;5(11):136. doi: 10.1186/1465-9921-11-136. [DOI] [PMC free article] [PubMed] [Google Scholar]
- 11.Sciurba FC, Ernst A, Herth FJ, Strange C, Criner GJ, Marquette CH, et al. A randomized study of endobronchial valves for advanced emphysema. N Engl J Med. 2010;363:1233–44. doi: 10.1056/NEJMoa0900928. [DOI] [PubMed] [Google Scholar]
- 12.Hayhurst MD, MacNee W, Flenley DC, Wright D, McLean A, Lamb D, et al. Diagnosis of pulmonary emphysema by computerised tomography. Lancet. 1984;2:320–2. doi: 10.1016/s0140-6736(84)92689-8. [DOI] [PubMed] [Google Scholar]
- 13.Coxson HO. Lung parenchyma density and airwall thickness in airway diseases. Breathe. 2012;9:36–45. [Google Scholar]
- 14.Stolk J, Versteegh MI, Montenij LJ, Bakker ME, Grebski E, Tutic M, et al. Densitometry for assessment of effect of lung volume reduction surgery for emphysema. Eur Respir J. 2007;29:1138–43. doi: 10.1183/09031936.00056206. [DOI] [PubMed] [Google Scholar]
- 15.Müller NL, Staples CA, Miller RR, Abboud RT. “Density mask”.An objective method to quantitate emphysema using computed tomography. Chest. 1988;94:782–7. doi: 10.1378/chest.94.4.782. [DOI] [PubMed] [Google Scholar]
- 16.Kinsella M, Müller NL, Abboud RT, Morrison NJ, DyBuncio A. Quantitation of emphysema by computed tomography using a “density mask” program and correlation with pulmonary function tests. Chest. 1990;97:315–21. doi: 10.1378/chest.97.2.315. [DOI] [PubMed] [Google Scholar]
- 17.Gevenois PA, de Maertelaer V, De Vuyst P, Zanen J, Yernault JC. Comparison of computed density and macroscopic morphometry in pulmonary emphysema. Am J Respir Crit Care Med. 1995;152:653–7. doi: 10.1164/ajrccm.152.2.7633722. [DOI] [PubMed] [Google Scholar]
- 18.Gevenois PA, De Vuyst P, de Maertelaer V, Zanen J, Jacobovitz D, Cosio MG, et al. Comparison of computed density and microscopic morphometry in pulmonary emphysema. Am J Respir Crit Care Med. 1996;154:187–92. doi: 10.1164/ajrccm.154.1.8680679. [DOI] [PubMed] [Google Scholar]
- 19.Coxson HO, Dirksen A, Edwards LD, Yates JC, Agusti A, Bakke P, et al. The presence and progression of emphysema in COPD as determined by CT scanning and biomarker expression: A prospective analysis from the ECLIPSE study. Lancet Respir Med. 2013;1:129–36. doi: 10.1016/S2213-2600(13)70006-7. [DOI] [PubMed] [Google Scholar]
- 20.Regan EA, Hokanson JE, Murphy JR, Make B, Lynch DA, Beaty TH, et al. Genetic epidemiology of COPD (COPDGene) study design. COPD. 2010;7:32–43. doi: 10.3109/15412550903499522. [DOI] [PMC free article] [PubMed] [Google Scholar]
- 21.Heussel CP, Herth FJ, Kappes J, Hantusch R, Hartlieb S, Weinheimer O, et al. Fully automatic quantitative assessment of emphysema in computed tomography: Comparison with pulmonary function testing and normal values. Eur Radiol. 2009;19:2391–402. doi: 10.1007/s00330-009-1437-z. [DOI] [PubMed] [Google Scholar]
- 22.Lynch DA, Newell JD. Quantitative imaging of COPD. J Thorac Imaging. 2009;24:189–94. doi: 10.1097/RTI.0b013e3181b31cf0. [DOI] [PubMed] [Google Scholar]
- 23.Matsuoka S, Yamashiro T, Washko GR, Kurihara Y, Nakajima Y, Hatabu H. Quantitative CT assessment of chronic obstructive pulmonary disease. Radiographics. 2010;30:55–66. doi: 10.1148/rg.301095110. [DOI] [PubMed] [Google Scholar]
- 24.Dirksen A. Monitoring the progress of emphysema by repeat computed tomography scans with focus on noise reduction. Proc Am Thorac Soc. 2008;5:925–8. doi: 10.1513/pats.200804-033QC. [DOI] [PubMed] [Google Scholar]
- 25.Hersh CP, Washko GR, Jacobson FL, Gill R, Estepar RS, Reilly JJ, et al. Interobserver variability in the determination of upper lobe-predominant emphysema. Chest. 2007;131:424–31. doi: 10.1378/chest.06-1040. [DOI] [PubMed] [Google Scholar]
- 26.Cavigli E, Camiciottoli G, Diciotti S, Orlandi I, Spinelli C, Meoni E, et al. Whole-lung densitometry versus visual assessment of emphysema. Eur Radiol. 2009;19:1686–92. doi: 10.1007/s00330-009-1320-y. [DOI] [PubMed] [Google Scholar]
- 27.Stolk J, Dirksen A, van der Lugt AA, Hutsebaut J, Mathieu J, de Ree J, et al. Repeatability of lung density measurements with low-dose computed tomography in subjects with alpha-1-antitrypsin deficiency-associated emphysema. Invest Radiol. 2001;36:648–51. doi: 10.1097/00004424-200111000-00004. [DOI] [PubMed] [Google Scholar]
- 28.Bakker ME, Stolk J, Putter H, Shaker SB, Parr DG, Piitulainen E, et al. Variability in densitometric assessment of pulmonary emphysema with computed tomography. Invest Radiol. 2005;40:777–83. doi: 10.1097/01.rli.0000186418.31139.21. [DOI] [PubMed] [Google Scholar]
- 29.Remy-Jardin M, Remy J, Gosselin B, Becette V, Edme JL. Lung parenchymal changes secondary to cigarette smoking: Pathologic-CT correlations. Radiology. 1993;186:643–51. doi: 10.1148/radiology.186.3.8430168. [DOI] [PubMed] [Google Scholar]
- 30.Gurney JW, Jones KK, Robbins RA, Gossman GL, Nelson KJ, Daughton D, et al. Regional distribution of emphysema: Correlation of high-resolution CT with pulmonary function tests in unselected smokers. Radiology. 1992;183:457–63. doi: 10.1148/radiology.183.2.1561350. [DOI] [PubMed] [Google Scholar]
- 31.Bild DE, Bluemke DA, Burke GL, Detrano R, Diez Roux AV, Folsom AR, et al. Multi-ethnic study of atherosclerosis: Objectives and design. Am J Epidemiol. 2002;156:871–81. doi: 10.1093/aje/kwf113. [DOI] [PubMed] [Google Scholar]
- 32.Couper D, LaVange LM, Han M, Barr RG, Bleecker E, Hoffman EA, et al. Design of the subpopulations and intermediate outcomes in COPD study (SPIROMICS) Thorax. 2014;69:491–4. doi: 10.1136/thoraxjnl-2013-203897. [DOI] [PMC free article] [PubMed] [Google Scholar]
- 33.Vestbo J, Anderson W, Coxson HO, Crim C, Dawber F, Edwards L, et al. Evaluation of COPD longitudinally to identify predictive surrogate end-points (ECLIPSE) Eur Respir J. 2008;31:869–73. doi: 10.1183/09031936.00111707. [DOI] [PubMed] [Google Scholar]
- 34.Bourbeau J, Tan WC, Benedetti A, Aaron SD, Chapman KR, Coxson HO, et al. Canadian cohort obstructive lung disease (CanCOLD): Fulfilling the need for longitudinal observational studies in COPD. COPD. 2014;11:125–32. doi: 10.3109/15412555.2012.665520. [DOI] [PubMed] [Google Scholar]
- 35.Aysola RS, Hoffman EA, Gierada D, Wenzel S, Cook-Granroth J, Tarsi J, et al. Airway remodeling measured by multidetector CT is increased in severe asthma and correlates with pathology. Chest. 2008;134:1183–91. doi: 10.1378/chest.07-2779. [DOI] [PMC free article] [PubMed] [Google Scholar]
- 36.Madani A, Van Muylem A, Gevenois PA. Pulmonary emphysema: Effect of lung volume on objective quantification at thin-section CT. Radiology. 2010;257:260–8. doi: 10.1148/radiol.10091446. [DOI] [PubMed] [Google Scholar]
- 37.Newell JD, Jr, Sieren J, Hoffman EA. Development of quantitative computed tomography lung protocols. J Thorac Imaging. 2013;28:266–71. doi: 10.1097/RTI.0b013e31829f6796. [DOI] [PMC free article] [PubMed] [Google Scholar]
- 38.Lynch D. Progress in imaging COPD, 2004-2014. J COPD F. 2014;1:73–82. doi: 10.15326/jcopdf.1.1.2014.0125. [DOI] [PMC free article] [PubMed] [Google Scholar]
- 39.Schroeder JD, McKenzie AS, Zach JA, Wilson CG, Curran-Everett D, Stinson DS, et al. Relationships between airflow obstruction and quantitative CT measurements of emphysema, air trapping, and airways in subjects with and without chronic obstructive pulmonary disease. AJR Am J Roentgenol. 2013;201:W460–70. doi: 10.2214/AJR.12.10102. [DOI] [PMC free article] [PubMed] [Google Scholar]
- 40.Murphy K, Pluim JP, van Rikxoort EM, de Jong PA, de Hoop B, Gietema HA, et al. Toward automatic regional analysis of pulmonary function using inspiration and expiration thoracic CT. Med Phys. 2012;39:1650–62. doi: 10.1118/1.3687891. [DOI] [PubMed] [Google Scholar]
- 41.Leipsic J, Nguyen G, Brown J, Sin D, Mayo JR. A prospective evaluation of dose reduction and image quality in chest CT using adaptive statistical iterative reconstruction. AJR Am J Roentgenol. 2010;195:1095–9. doi: 10.2214/AJR.09.4050. [DOI] [PubMed] [Google Scholar]
- 42.Mets OM, de Jong PA, van Ginneken B, Gietema HA, Lammers JW. Quantitative computed tomography in COPD: Possibilities and limitations. Lung. 2012;190:133–45. doi: 10.1007/s00408-011-9353-9. [DOI] [PMC free article] [PubMed] [Google Scholar]
- 43.Galbán CJ, Han MK, Boes JL, Chughtai KA, Meyer CR, Johnson TD, et al. Computed tomography-based biomarker provides unique signature for diagnosis of COPD phenotypes and disease progression. Nat Med. 2012;18:1711–5. doi: 10.1038/nm.2971. [DOI] [PMC free article] [PubMed] [Google Scholar]
- 44.Pompe E, van Rikxoort EM, Schmidt M, Rühaak J, Estrella LG, Vliegenthart R, et al. Parametric response mapping adds value to current computed tomography biomarkers in diagnosing chronic obstructive pulmonary disease. Am J Respir Crit Care Med. 2015;191:1084–6. doi: 10.1164/rccm.201411-2105LE. [DOI] [PubMed] [Google Scholar]
- 45.Miller RR, Müller NL, Vedal S, Morrison NJ, Staples CA. Limitations of computed tomography in the assessment of emphysema. Am Rev Respir Dis. 1989;139:980–3. doi: 10.1164/ajrccm/139.4.980. [DOI] [PubMed] [Google Scholar]
- 46.Bafadhel M, Umar I, Gupta S, Raj JV, Vara DD, Entwisle JJ, et al. The role of CT scanning in multidimensional phenotyping of COPD. Chest. 2011;140:634–42. doi: 10.1378/chest.10-3007. [DOI] [PMC free article] [PubMed] [Google Scholar]
- 47.Brown RH, Mitzner W, Bulut Y, Wagner EM. Effect of lung inflation in vivo on airways with smooth muscle tone or edema. J Appl Physiol (1985) 1997;82:491–9. doi: 10.1152/jappl.1997.82.2.491. [DOI] [PubMed] [Google Scholar]
- 48.Brown RH, Mitzner W. Effect of lung inflation and airway muscle tone on airway diameter in vivo. J Appl Physiol (1985) 1996;80:1581–8. doi: 10.1152/jappl.1996.80.5.1581. [DOI] [PubMed] [Google Scholar]
- 49.Nakano Y, Whittall KP, Kalloger SE, Coxon HO, Pare PD, English JC. Development and validation of human airway analysis algorithm using multidetector row CT. Proc SPIE. 2002;4683:460–9. [Google Scholar]
- 50.Nakano Y, Wong JC, de Jong PA, Buzatu L, Nagao T, Coxson HO, et al. The prediction of small airway dimensions using computed tomography. Am J Respir Crit Care Med. 2005;171:142–6. doi: 10.1164/rccm.200407-874OC. [DOI] [PubMed] [Google Scholar]
- 51.Hasegawa M, Nasuhara Y, Onodera Y, Makita H, Nagai K, Fuke S, et al. Airflow limitation and airway dimensions in chronic obstructive pulmonary disease. Am J Respir Crit Care Med. 2006;173:1309–15. doi: 10.1164/rccm.200601-037OC. [DOI] [PubMed] [Google Scholar]
- 52.Grydeland TB, Dirksen A, Coxson HO, Eagan TM, Thorsen E, Pillai SG, et al. Quantitative computed tomography measures of emphysema and airway wall thickness are related to respiratory symptoms. Am J Respir Crit Care Med. 2010;181:353–9. doi: 10.1164/rccm.200907-1008OC. [DOI] [PubMed] [Google Scholar]