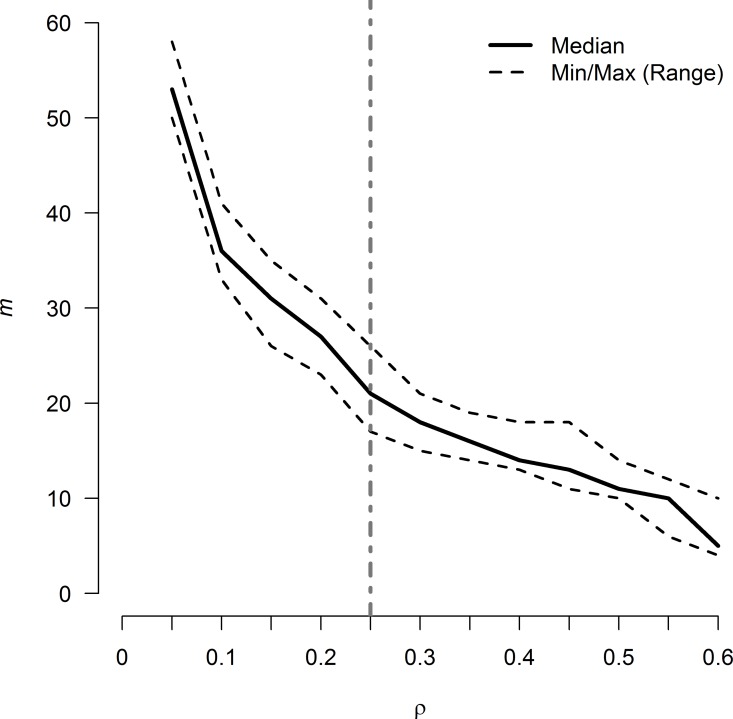
Fig 2. Size of Markov networks of AMR surveillance data (m) over L1 regularization values.
R-nets were generated using 12 L1 penalty values (ρ), from 0.05 to 0.60 in increments of 0.05 for all 9 time periods in the study. The solid line represents the median graph size (m50) for the set R, which contains one R-net for each of the 9 years in the study at each evaluated value of ρ, and the dashed lines above and below m50 represent the maximum and minimum size of R, respectively. R-net size decreased rapidly until ρ ~ 0.3, where the slope started to stabilize. The slope of m50 appeared to change most abruptly near ρ = 0.10 and ρ = 0.25. The vertical line at ρ = 0.25 represents the set of R-nets presented in Fig 3. The set of R-nets generated at ρ = 0.10 are presented in S3-1 Fig with further discussion in S3.

