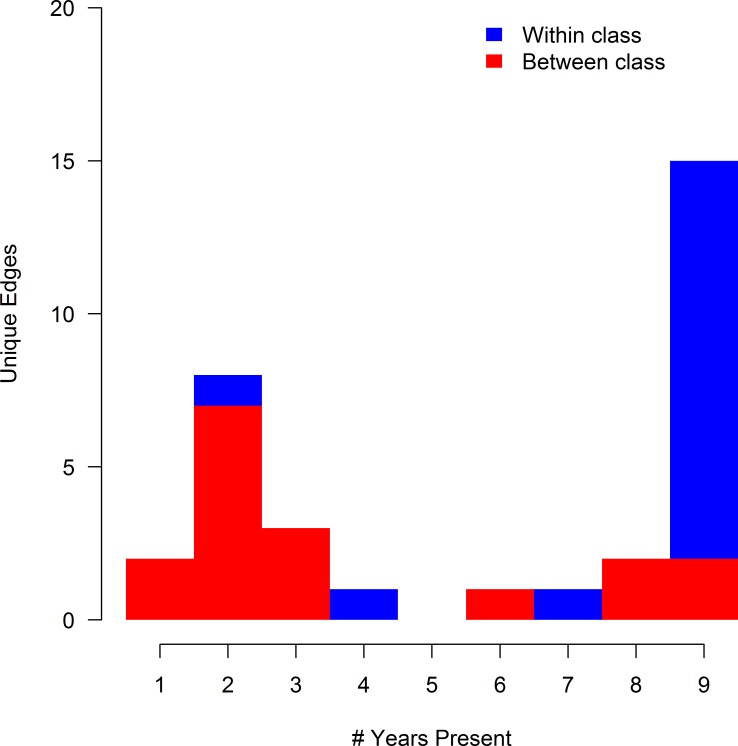
Fig 4. Histogram of edge frequency in Markov networks of AMR surveillance data.
Thirty-three unique edges were identified in 9 Markov networks estimated using AMR data from 14,418 total isolates of E. coli collected from chicken carcass rinsates (USDA-ARS) and commercial chicken breasts (FDA) between 2004 and 2012. Networks were generated via the graphical least absolute shrinkage and selection operator with ρ = 0.25. Edges are categorized by the types of antibiotic resistances they joined, either resistances from the same class (blue) or different classes (red).

