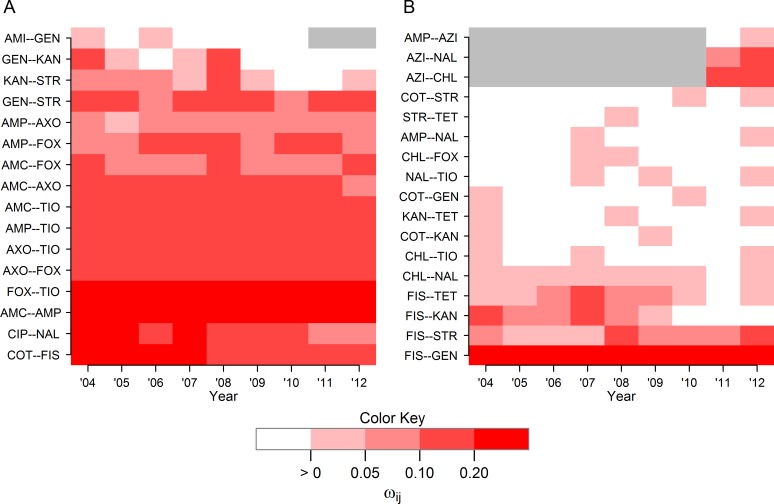
Fig 5. Heatmap of non-zero partial correlations between drug resistances over time.
(A) Edge weights for 16 edges between resistances of drugs of the same class and (B) 17 edges between resistances to drugs of different classes in Markov networks of AMR data. Resistance data was collected from 14,418 total isolates of E. coli collected from chicken carcass rinsates and commercial chicken breasts between 2004 to 2012. Networks were generated via the graphical least absolute shrinkage and selection operator with ρ = 0.25. Grey areas represent years of missing data due one of the antibiotic drugs was not included in the panel (AMI after 2010 and AZI prior to 2011).

