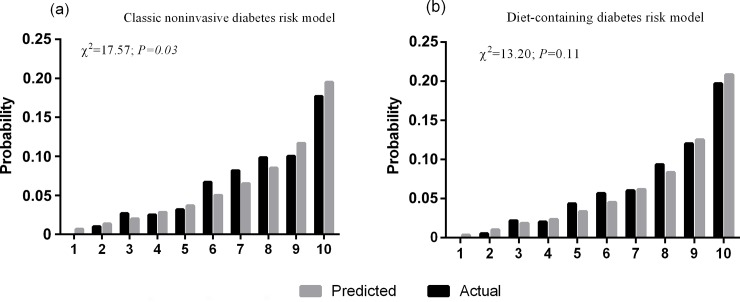
Fig 1. The Hosmer-Lemeshow Goodness-of-fit Test for the Diet-containing Diabetes Risk Model and Classic Noninvasive Diabetes Risk Model.
X-axes indicate the deciles of the predicted risk of type 2 diabetes, and y-axes indicate the probability of type 2 diabetes events. P-values from χ2 statistics calculated to compare the difference between the predicted and the actual incidence of type 2 diabetes.

