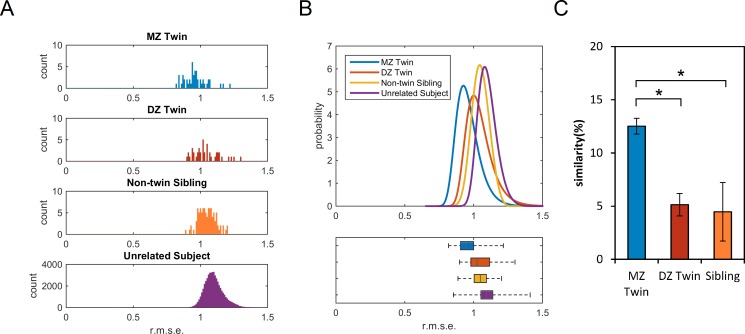
Fig 7. The differences and similarities between twins and siblings.
(A) The histograms show the distribution of the root-mean-square-error (r.m.s.e) between MZ twins, DZ twins, non-twin siblings, and genetically unrelated subjects calculated from their local connectome fingerprints. On average, MZ twins have the lowest difference between each twin pair, followed by DZ twins and siblings. (B) The upper figure shows the differences fitted with generalized extreme value distribution. The lower figure shows the box plot of the distribution to facilitate comparison. The four distributions are mostly overlapping, indicating that twins and siblings still have high individuality similar to genetically-unrelated subjects. (C) The similarity between MZ twins is significantly higher than that between DZ twins or non-twin siblings, whereas the similarity between DZ twins is not statistically different from the similarity between non-twin siblings.

