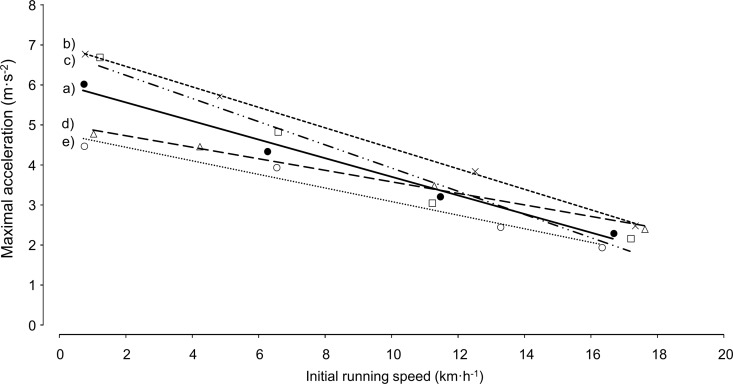
Fig 3. Individual linear regression lines of amax depending on vinit.
(a) Mean of all soccer players (n = 72) (black circles); (b) player with high amax at all vinit (cross); (c) player with high decrease in amax with increasing vinit (square); (d) player with low decrease in amax with increasing vinit (triangle); (e) player with low amax at all vinit (white circle).

