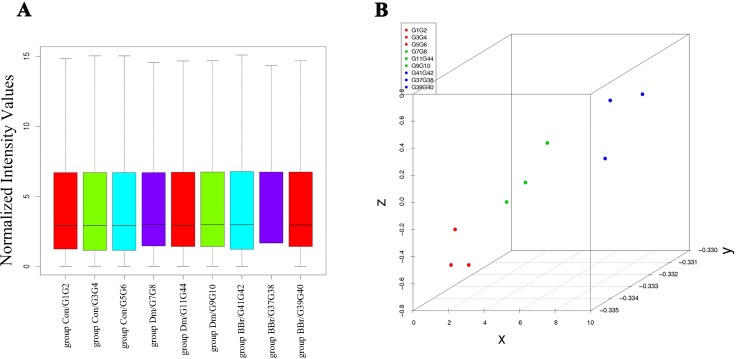
Fig 4. Plots of all of the differentially expressed genes.
A. Box plot of the genes that were differentially expressed in the Con, DM and BBR groups; B. PCA plot of the genes that were differentially expressed in the Con, DM and BBR groups. The plot was constructed based on the fold-change in expression level and the significance of the differences, as determined from the P-values.

