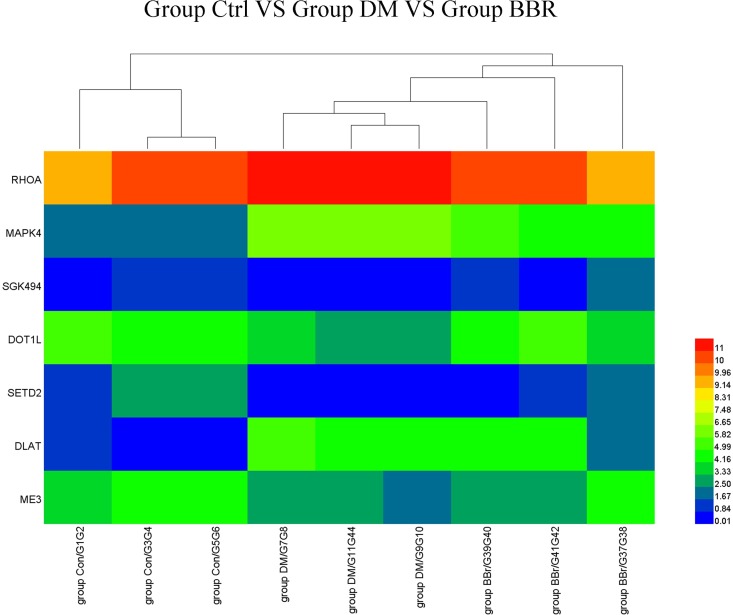
Fig 7. Heat map of the DEG expression levels.
Heat map showing the expression levels of the seven genes that were differentially expressed in the liver samples taken from the Con (n = 3), DM (n = 3) and BBR (n = 3) groups. Each row represents one gene, and each column represents a liver sample. The gene symbols are shown on the left side of the rows. The relative gene expression levels are depicted according to the color scale shown at the right. Red indicates high-level expression; blue indicates low-level expression.

