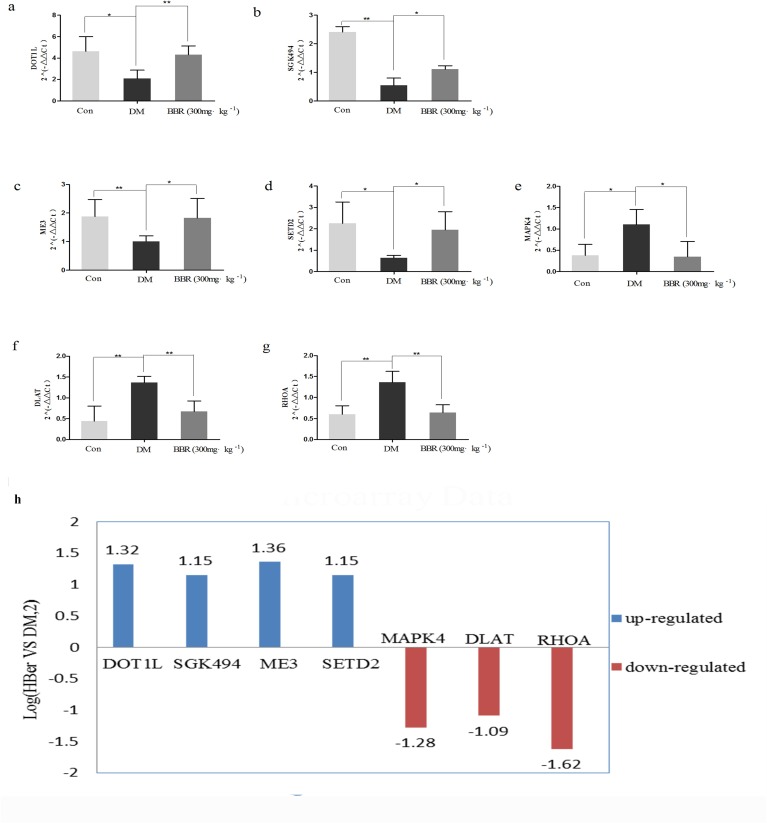
Fig 8. Validation of the microarray data using qRT-PCR.
Relative expression levels of the seven DEGs (RHOA, MAPK4, SGK494, DOT1L, SETD2, ME3, and DLAT) determined using qRT-PCR. The P-values were calculated using a one-way ANOVA (**P<0.01;*P<0.05). The qRT-PCR results were consistent with the microarray data.

