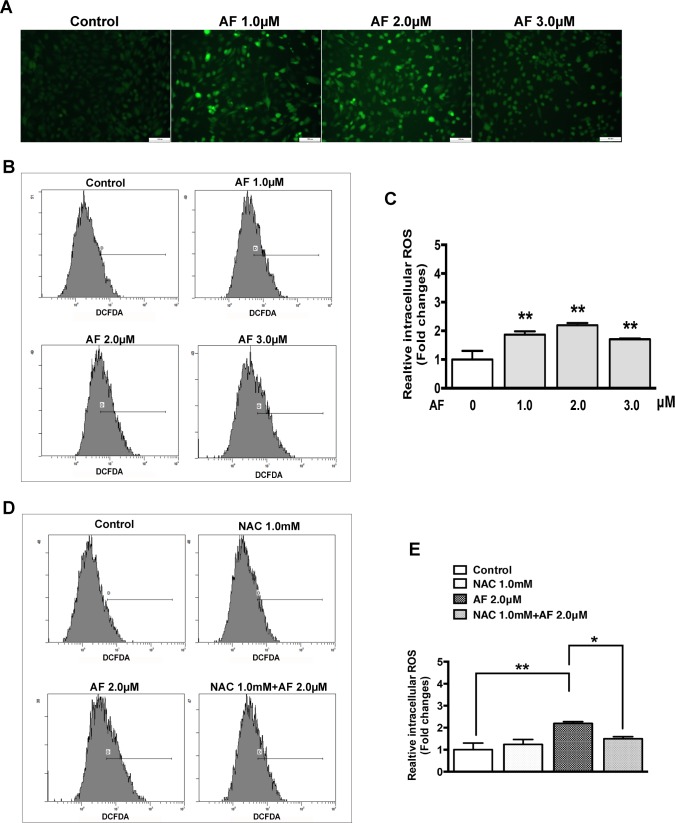
Fig 2. Auranofin induces an increase in reactive oxygen species (ROS) in ARPE-19 cells.
(A) Fluorescent photomicrographs of ARPE-19 cells after treatment with 0–3.0 μM AF for 12 hours and DCFDA staining for 20 minutes. Green fluorescence of DCF was observed by fluorescence microscope. Scale bar = 100μm. (B) The fluorescence density of DCF was measured by flow cytometery after ARPE-19 cells were treated with 0–3.0 μM AF for 12 hours and stained with DCFDA for 20 minutes. (C) The histogram represents quantified data of fluorescence density of DCF shown in panel B (data are means ± SEM, n = 3, *P<0.05, **P<0.01, compared with control). (D) The fluorescence density of DCF was measured by flow cytometry after ARPE-19 cells with or without 1.0 mM N-acetylcysteine (NAC) pretreatment for 2 hours were treated by 2.0 μM AF for 12 hours and stained with DCFDA for 20 minutes. (E) The histogram represents quantified data of fluorescence density of DCF shown in panel D (data are means ± SEM, n = 3, *P<0.05, **P<0.01).

