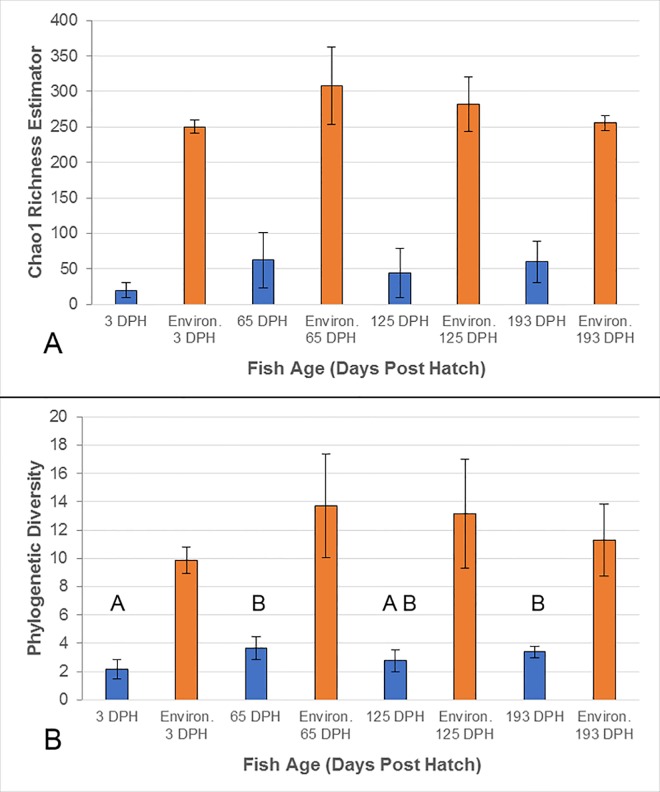
Fig 2. Alpha diversity of the intestinal microbiota of channel catfish and the combined environmental microbiota (administered diets and water-supply) at each sampling point (days post hatch, DPH).
Bars represent the group means of fish samples (blue) and the environmental samples associated with fish at each time point (orange), with error bars displaying the SD. Alpha diversity is represented by Chao1 species richness estimator (A) and whole-tree phylogenetic diversity (B). An ANOVA followed by Tukey’s post-hoc test was conducted across all intestinal samples to detected differences in alpha diversity over time (P ≤ 0.05). No differences were detected for Chao 1 (A), while letters indicate significant differences detected in phylogenetic distance (B). Two-tailed Welch t-tests detected significant differences (P < 0.05) between the intestinal samples and the combined environmental samples at all time points, based upon either index.

