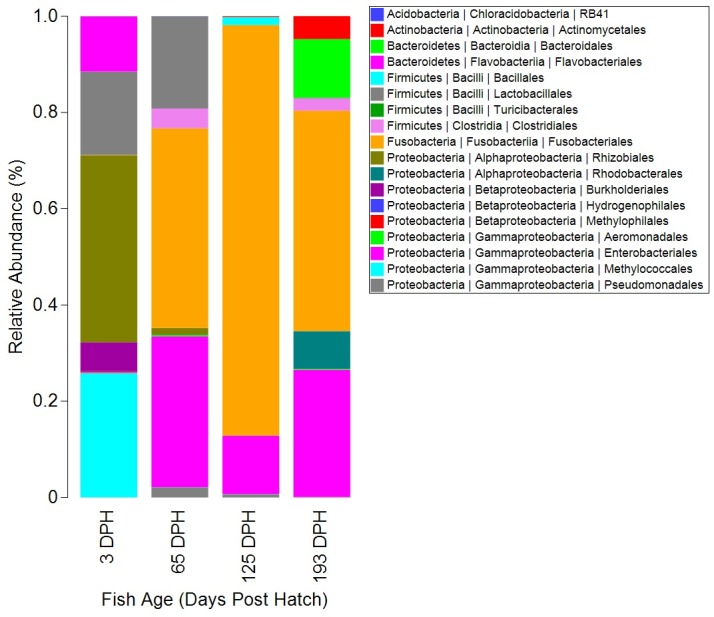
Fig 4. Relative abundance of bacterial orders detected in the intestinal microbiota of channel catfish sampled at 3, 65, 125, and 193 days post hatch (DPH).

Bars represent the averages taken from all fish included in analysis at each time point. Legend indicates hierarchical taxonomy of OTUs at three taxonomic levels (phyla | class | order). Microbiota were filtered to remove chloroplast OTUs derived from plant material in the diets, and eukaryotic mitochondrial reads, as well as removing OTUs representing less than 0.0001% of the total abundance.
