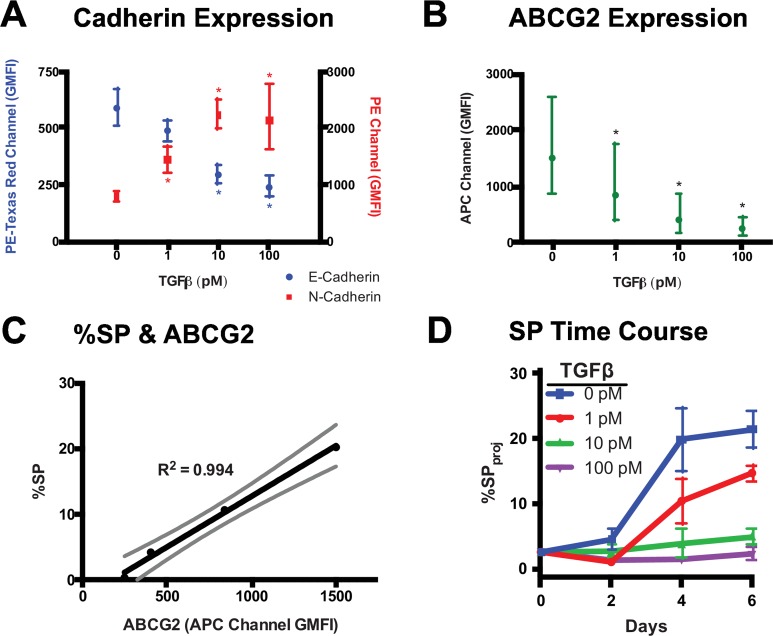
Fig 2. Surface Marker Staining & SP Size Following TGFβ-Mediated EMT.
Surface marker expression measured via flow cytometry after staining with anti-PE-CF594/E-Cadherin, PE/N-Cadherin (A), and APC/ABCG2 (B) antibodies on live A549 cells following 4-day treatment with 0, 1, 10, and 100 pM TGFβ. Surface marker staining data were obtained from 3-color staining, with compensation, from 3 biological replicates. Values are plotted as the geometric mean ± 95% confidence interval of the sample geometric mean fluorescence intensities (GMFI). A significant difference from the 0 pM TGFβ condition was determined with a two-way ANOVA, p<0.05, and are indicated by asterisks (*). (C) Mean %SP versus ABCG2 expression for the Day 4 condition from the SP time course experiment, along with a best-fit line from a linear regression, R2 shown, and 95% confidence interval. (D) SP size measured by projection gating with increasing time in culture (up to 6 days) and TGFβ. Performed in triplicate and plotted as mean ± SEM.

