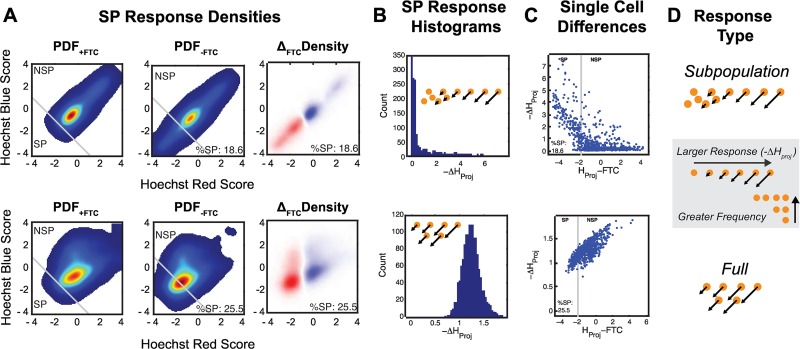
Fig 5. Simulated Staining Population Distributions and Single-Cell Responses.
Output from ensembles producing a Subpopulation (above) and Full (below) response are shown. (A) Population densities and differences in staining between simulated +FTC and–FTC conditions demonstrate SP responses and can be compared to corresponding experimental conditions for the untreated control (S1 Fig & S2 Fig). (B) Histograms of the change in staining between +FTC and–FTC conditions for single cells. (C) Plot of the change in staining between +FTC and–FTC conditions for single cells (y-axis) compared to the staining intensity in the–FTC condition (x-axis), shown with the SP and SP gate boundary set by projection gating. (D) Schematic of relative frequencies of single-cell -ΔHproj distributions for Subpopulation and Full response types.

