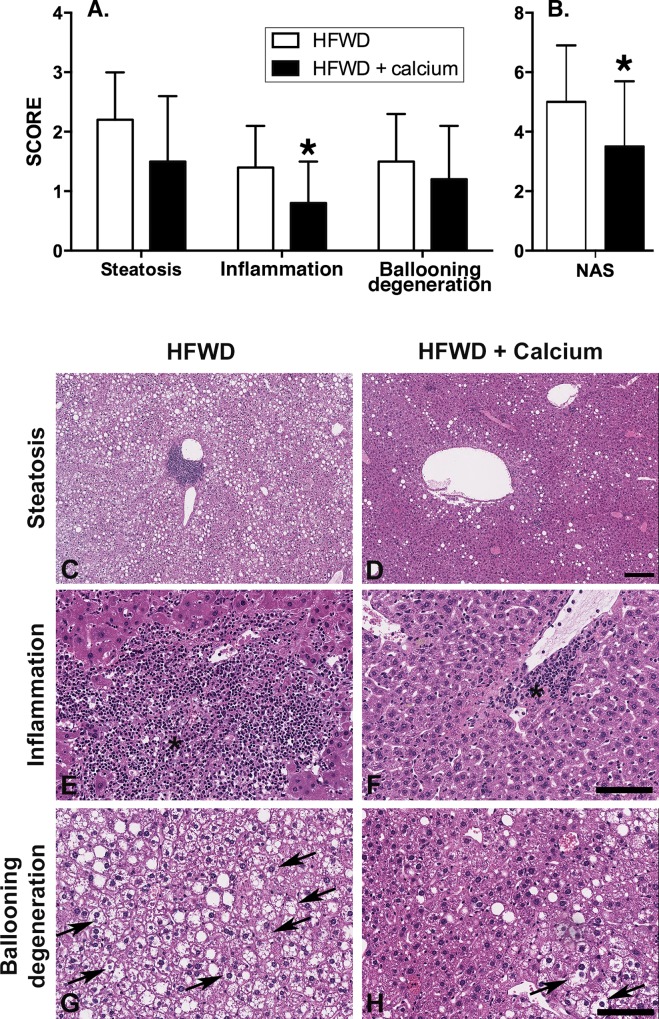
Fig 1. Histological assessment of NASH and liver injury.
Histological sections were scored per established criteria (see Methods) in 19 of 20 HFWD mice and 20 of 20 HFWD-Ca mice. A. Individual components of NASH-related liver injury. B. NAS, calculated as the sum of the individual scores for the three component parameters. Inflammation and overall NAS were significantly lower in the HFWD-Ca group. (Mann-Whitney U, Steatosis, p = 0.1; Inflammation, p = 0.014; ballooning degeneration, p = 0.25; Overall NAS, p = 0.023). C-H: Representative histological features of NASH-related liver injury. Steatosis (C and D) consisted of macrovesicular cytoplasmic fat deposition distributed multifocally or diffusely. Multifocal lesions were most commonly in an azonal (random) or pericentral (zone 3) pattern. Inflammation (E and F) consisted of variably sized foci of infiltrating macrophages and neutrophils, most commonly in midzonal or pericentral (zone 3) areas (asterisk). Ballooning degeneration (G and H) consisted of markedly swollen hepatocytes with cleared cytoplasm and non-displaced nuclei (arrows). Hematoxylin and eosin staining. Scale bars = 200μm [C,D] and 100μm [E-H].

